| __timestamp | Elbit Systems Ltd. | United Rentals, Inc. |
|---|---|---|
| Wednesday, January 1, 2014 | 825097000 | 2432000000 |
| Thursday, January 1, 2015 | 897053000 | 2480000000 |
| Friday, January 1, 2016 | 959583000 | 2403000000 |
| Sunday, January 1, 2017 | 997920000 | 2769000000 |
| Monday, January 1, 2018 | 976179000 | 3364000000 |
| Tuesday, January 1, 2019 | 1136467000 | 3670000000 |
| Wednesday, January 1, 2020 | 1165107000 | 3183000000 |
| Friday, January 1, 2021 | 1358048000 | 3853000000 |
| Saturday, January 1, 2022 | 1373283000 | 4996000000 |
| Sunday, January 1, 2023 | 1482954000 | 5813000000 |
| Monday, January 1, 2024 | 6150000000 |
Data in motion
In the ever-evolving landscape of global business, understanding the financial health of companies is crucial. This analysis delves into the gross profit trends of United Rentals, Inc. and Elbit Systems Ltd. from 2014 to 2023. Over this decade, United Rentals has consistently outperformed Elbit Systems, with its gross profit growing by approximately 140%, reaching a peak in 2023. In contrast, Elbit Systems saw a more modest increase of around 80% over the same period. Notably, United Rentals' gross profit surged past the $5.8 billion mark in 2023, while Elbit Systems reached approximately $1.5 billion. The data for 2024 is incomplete, highlighting the dynamic nature of financial forecasting. This comparison underscores the robust growth trajectory of United Rentals in the industrial equipment sector, while Elbit Systems maintains steady progress in the defense industry.
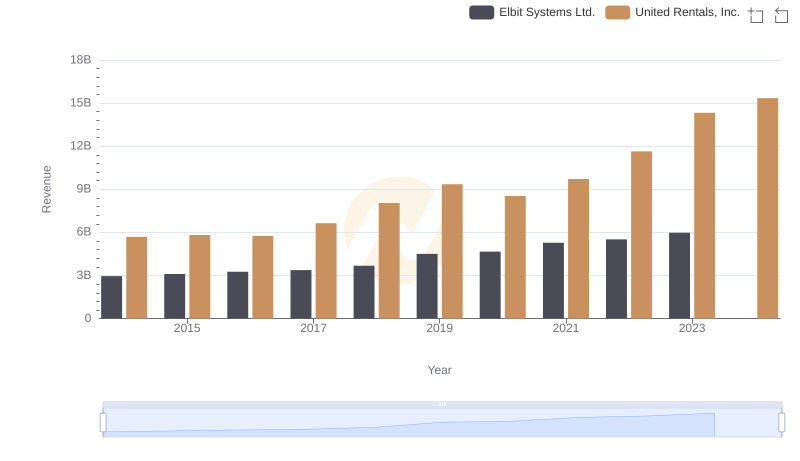
Breaking Down Revenue Trends: United Rentals, Inc. vs Elbit Systems Ltd.
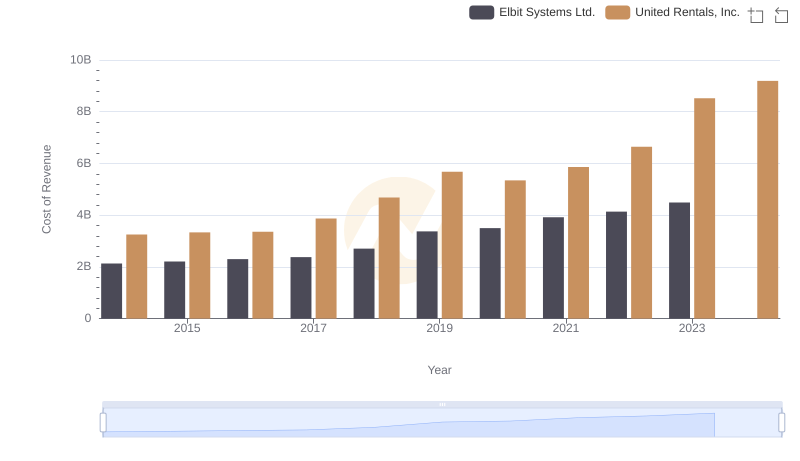
Comparing Cost of Revenue Efficiency: United Rentals, Inc. vs Elbit Systems Ltd.
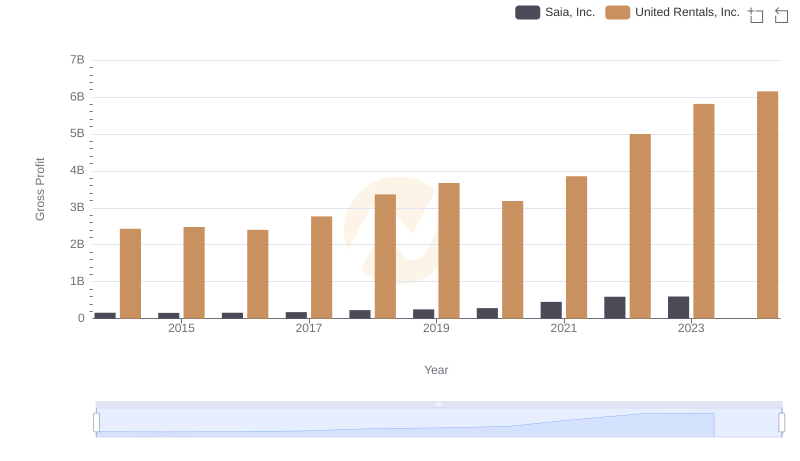
Gross Profit Comparison: United Rentals, Inc. and Saia, Inc. Trends

United Rentals, Inc. and Stanley Black & Decker, Inc.: A Detailed Gross Profit Analysis
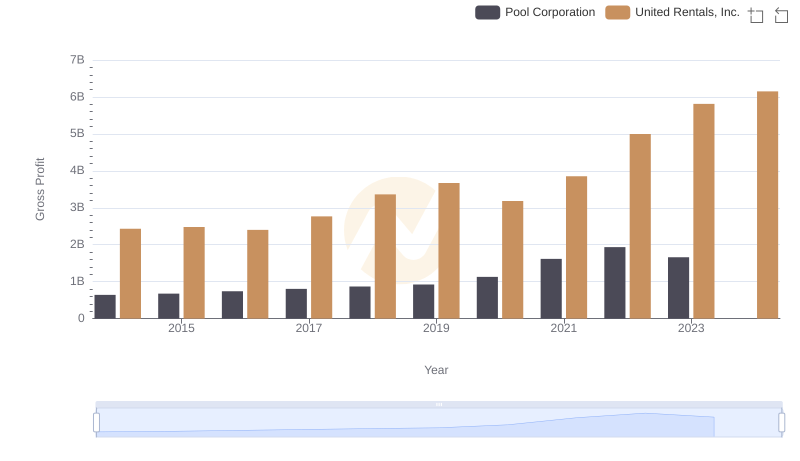
United Rentals, Inc. vs Pool Corporation: A Gross Profit Performance Breakdown

Gross Profit Comparison: United Rentals, Inc. and U-Haul Holding Company Trends

Gross Profit Trends Compared: United Rentals, Inc. vs C.H. Robinson Worldwide, Inc.
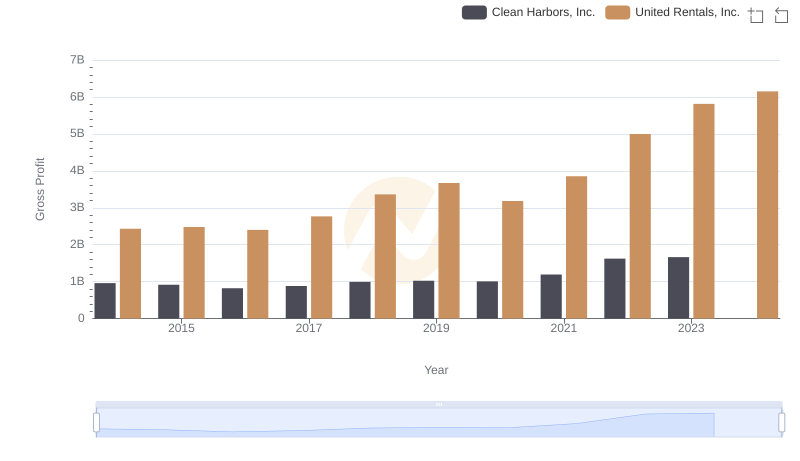
United Rentals, Inc. and Clean Harbors, Inc.: A Detailed Gross Profit Analysis

United Rentals, Inc. and Curtiss-Wright Corporation: A Detailed Gross Profit Analysis
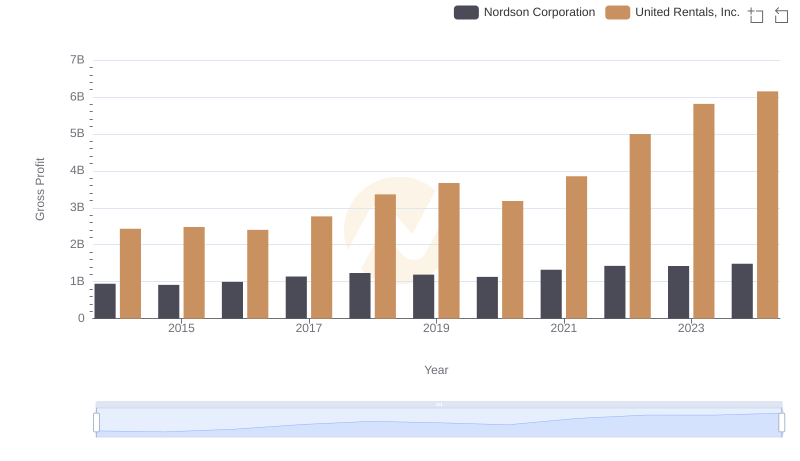
United Rentals, Inc. and Nordson Corporation: A Detailed Gross Profit Analysis
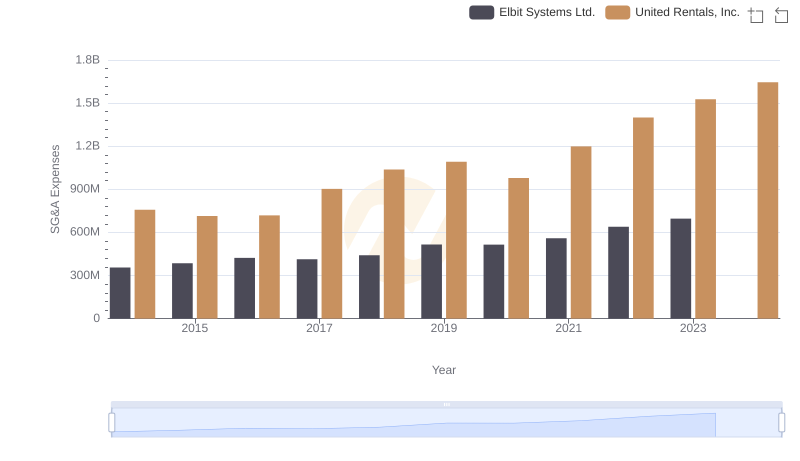
Operational Costs Compared: SG&A Analysis of United Rentals, Inc. and Elbit Systems Ltd.
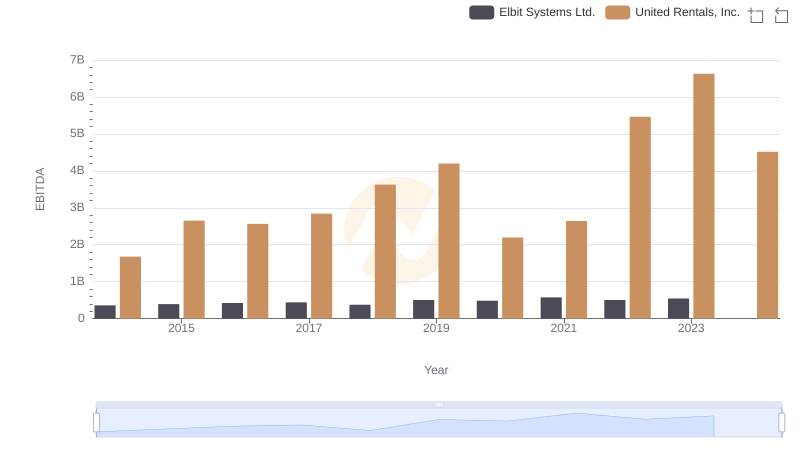
A Side-by-Side Analysis of EBITDA: United Rentals, Inc. and Elbit Systems Ltd.