| __timestamp | Elbit Systems Ltd. | United Rentals, Inc. |
|---|---|---|
| Wednesday, January 1, 2014 | 2958248000 | 5685000000 |
| Thursday, January 1, 2015 | 3107581000 | 5817000000 |
| Friday, January 1, 2016 | 3260219000 | 5762000000 |
| Sunday, January 1, 2017 | 3377825000 | 6641000000 |
| Monday, January 1, 2018 | 3683684000 | 8047000000 |
| Tuesday, January 1, 2019 | 4508400000 | 9351000000 |
| Wednesday, January 1, 2020 | 4662572000 | 8530000000 |
| Friday, January 1, 2021 | 5278521000 | 9716000000 |
| Saturday, January 1, 2022 | 5511549000 | 11642000000 |
| Sunday, January 1, 2023 | 5974744000 | 14332000000 |
| Monday, January 1, 2024 | 15345000000 |
Igniting the spark of knowledge
In the competitive landscape of global industries, United Rentals, Inc. and Elbit Systems Ltd. have showcased intriguing revenue trajectories over the past decade. From 2014 to 2023, United Rentals, Inc. has seen a robust growth, with revenue surging by approximately 152%, reaching a peak of $14.3 billion in 2023. This growth reflects the company's strategic expansions and market dominance in equipment rental services across North America.
Conversely, Elbit Systems Ltd., a key player in the defense and electronics sector, experienced a steady revenue increase of about 102% over the same period, culminating in $5.97 billion in 2023. This growth underscores the company's resilience and innovation in defense technology.
While United Rentals, Inc. continues to outpace Elbit Systems Ltd. in revenue, both companies demonstrate significant industry influence, albeit in different sectors. Notably, data for 2024 is incomplete, highlighting the dynamic nature of financial forecasting.

Breaking Down Revenue Trends: United Rentals, Inc. vs Stanley Black & Decker, Inc.
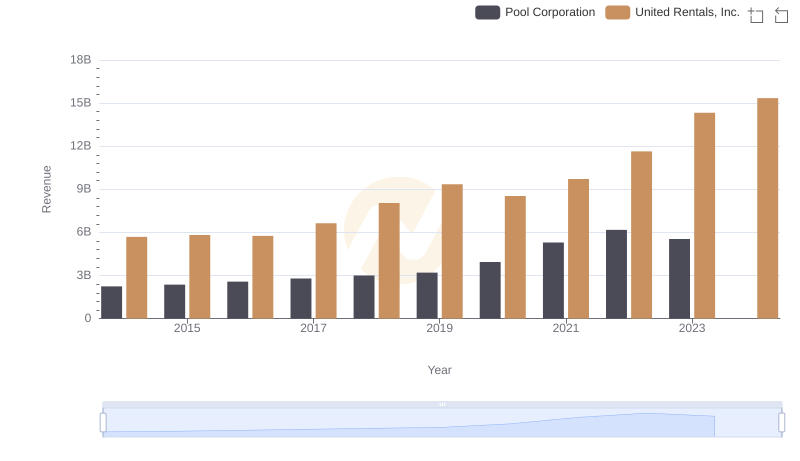
Annual Revenue Comparison: United Rentals, Inc. vs Pool Corporation

Breaking Down Revenue Trends: United Rentals, Inc. vs Saia, Inc.
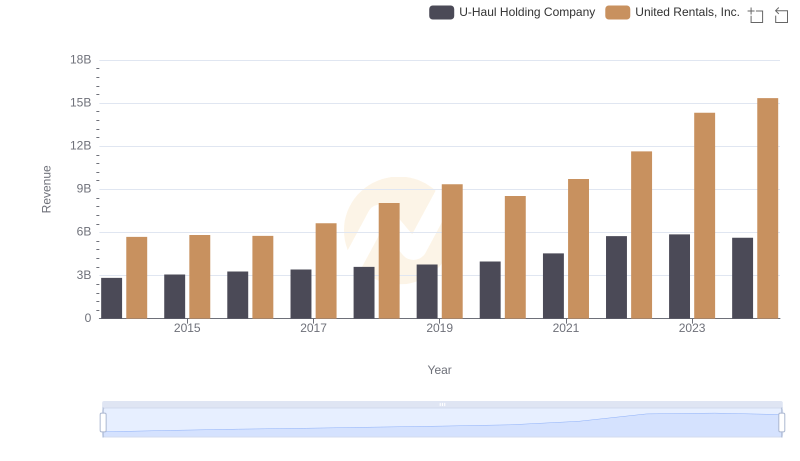
Revenue Showdown: United Rentals, Inc. vs U-Haul Holding Company
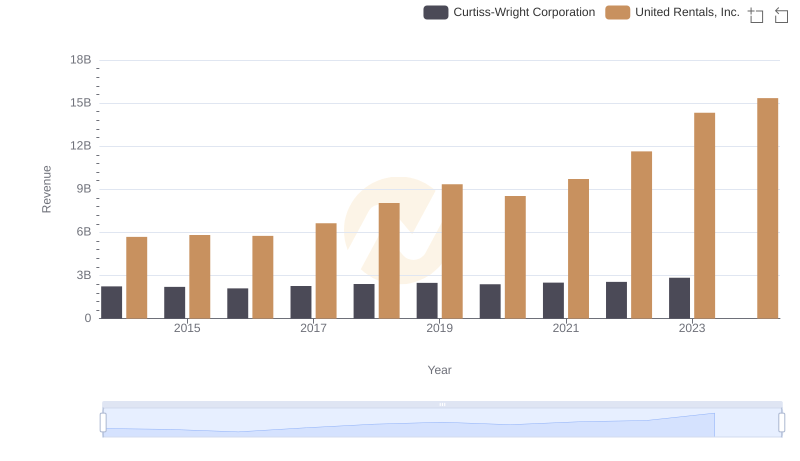
Who Generates More Revenue? United Rentals, Inc. or Curtiss-Wright Corporation
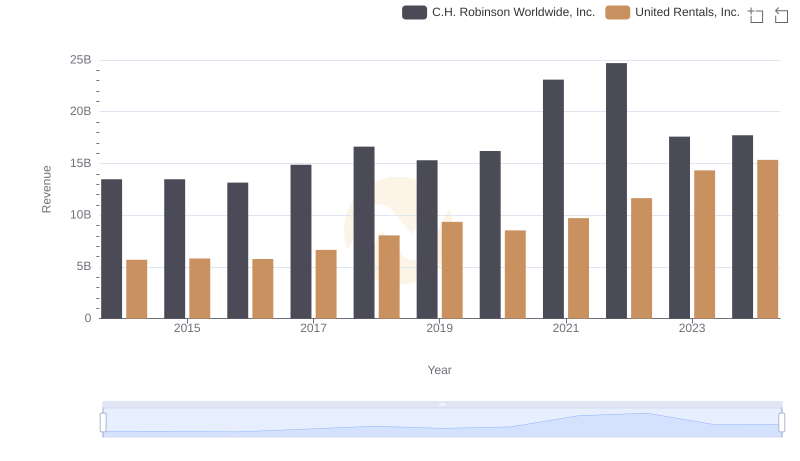
United Rentals, Inc. vs C.H. Robinson Worldwide, Inc.: Examining Key Revenue Metrics
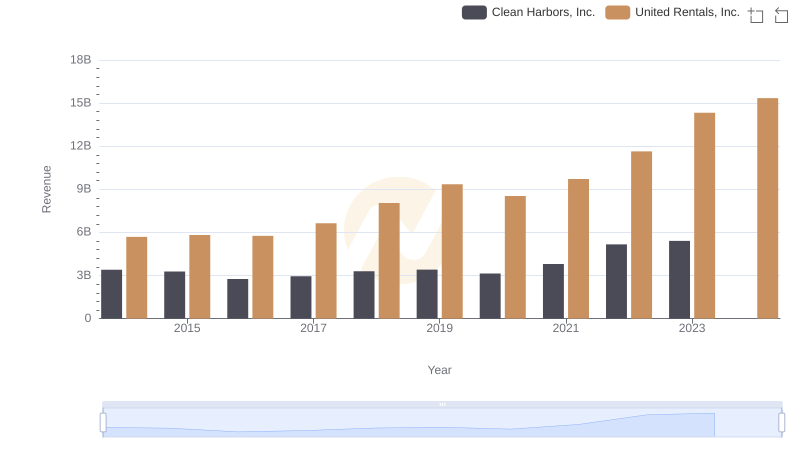
Breaking Down Revenue Trends: United Rentals, Inc. vs Clean Harbors, Inc.
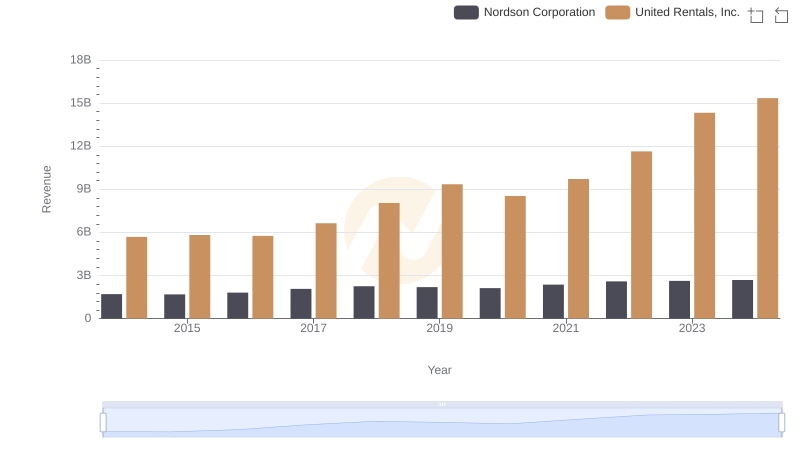
Revenue Showdown: United Rentals, Inc. vs Nordson Corporation
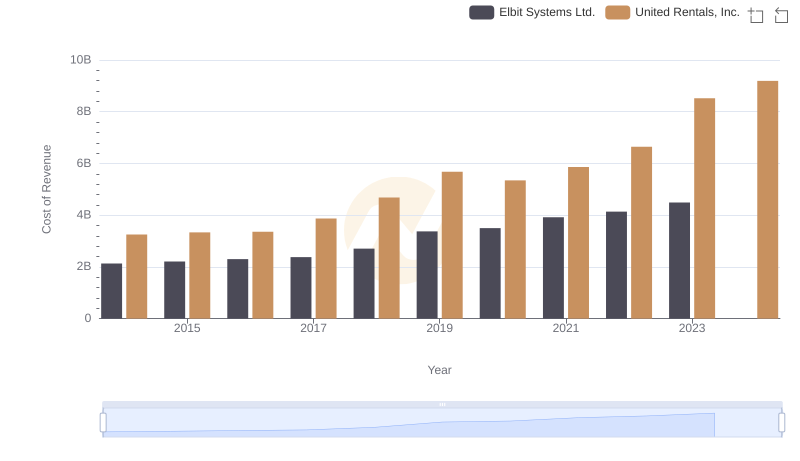
Comparing Cost of Revenue Efficiency: United Rentals, Inc. vs Elbit Systems Ltd.
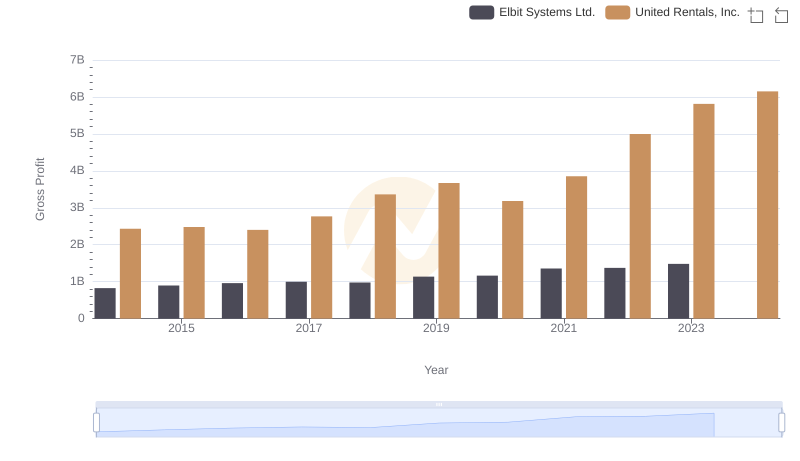
Gross Profit Analysis: Comparing United Rentals, Inc. and Elbit Systems Ltd.
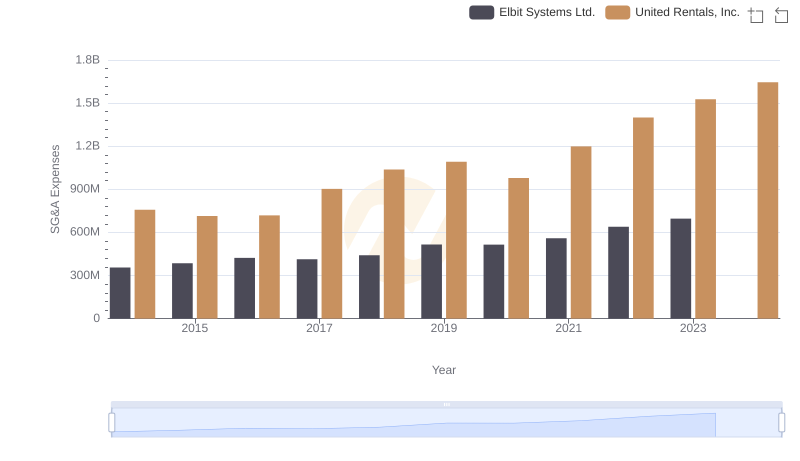
Operational Costs Compared: SG&A Analysis of United Rentals, Inc. and Elbit Systems Ltd.
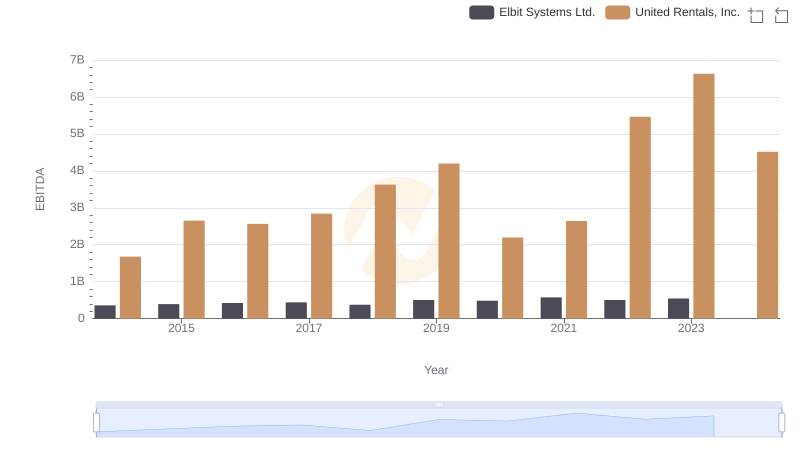
A Side-by-Side Analysis of EBITDA: United Rentals, Inc. and Elbit Systems Ltd.