| __timestamp | AMETEK, Inc. | United Rentals, Inc. |
|---|---|---|
| Wednesday, January 1, 2014 | 1424947000 | 2432000000 |
| Thursday, January 1, 2015 | 1425015000 | 2480000000 |
| Friday, January 1, 2016 | 1264867000 | 2403000000 |
| Sunday, January 1, 2017 | 1448739000 | 2769000000 |
| Monday, January 1, 2018 | 1659562000 | 3364000000 |
| Tuesday, January 1, 2019 | 1787660000 | 3670000000 |
| Wednesday, January 1, 2020 | 1543514000 | 3183000000 |
| Friday, January 1, 2021 | 1912614000 | 3853000000 |
| Saturday, January 1, 2022 | 2145269000 | 4996000000 |
| Sunday, January 1, 2023 | 2384465001 | 5813000000 |
| Monday, January 1, 2024 | 6941180000 | 6150000000 |
Igniting the spark of knowledge
In the competitive landscape of industrial equipment and electronic instruments, United Rentals, Inc. and AMETEK, Inc. have shown distinct trajectories in their gross profit over the past decade. Since 2014, United Rentals has consistently outperformed AMETEK, with a notable 139% increase in gross profit by 2023. This growth reflects United Rentals' strategic expansions and market dominance. Meanwhile, AMETEK has experienced a steady rise, achieving a 67% increase in the same period, showcasing its resilience and adaptability in the electronics sector.
The data reveals a significant leap for United Rentals in 2022, with a 30% surge, while AMETEK's growth was more gradual. Interestingly, 2024 data for AMETEK is missing, leaving room for speculation on its future performance. These insights highlight the dynamic nature of these industries and the strategic maneuvers companies must undertake to thrive.
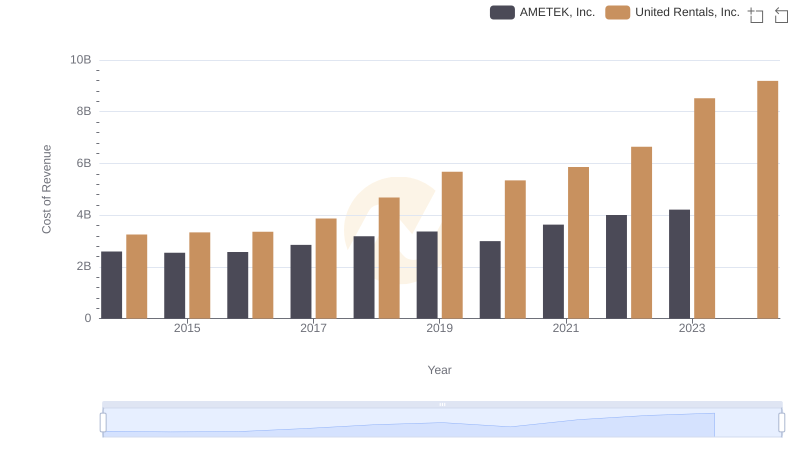
Comparing Cost of Revenue Efficiency: United Rentals, Inc. vs AMETEK, Inc.
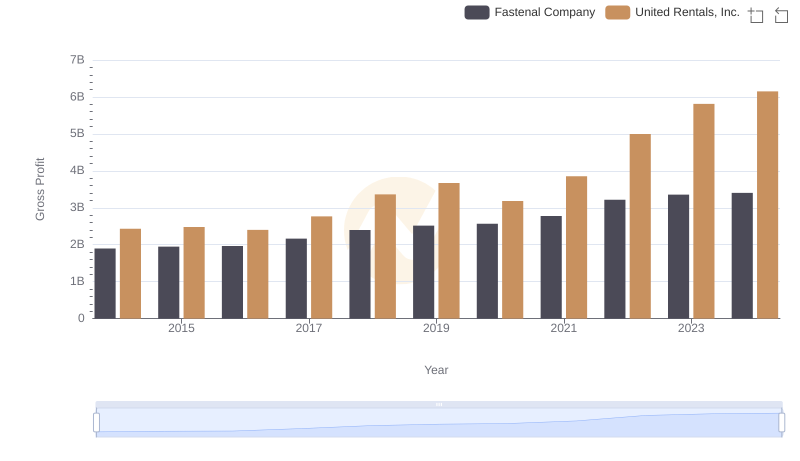
Gross Profit Comparison: United Rentals, Inc. and Fastenal Company Trends
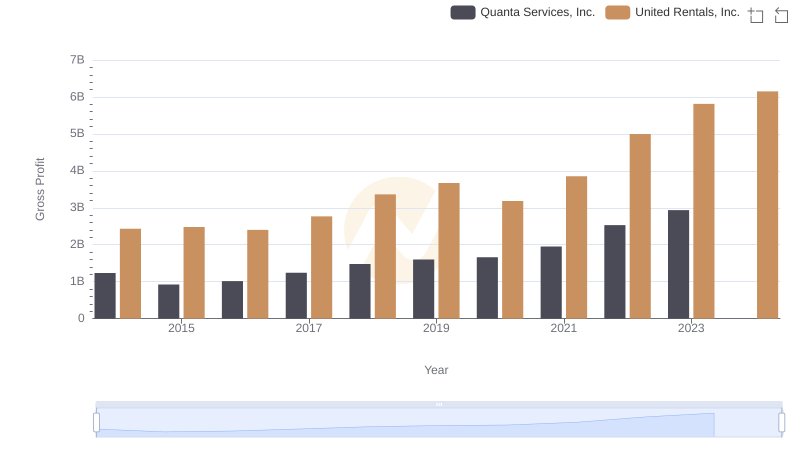
Gross Profit Comparison: United Rentals, Inc. and Quanta Services, Inc. Trends
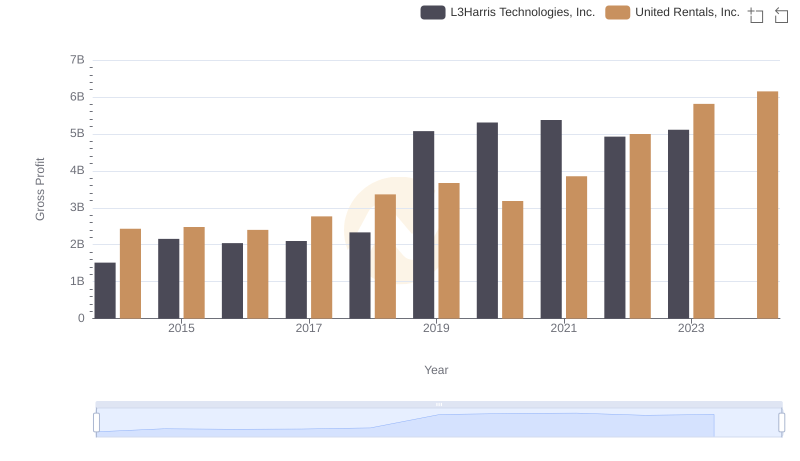
United Rentals, Inc. vs L3Harris Technologies, Inc.: A Gross Profit Performance Breakdown
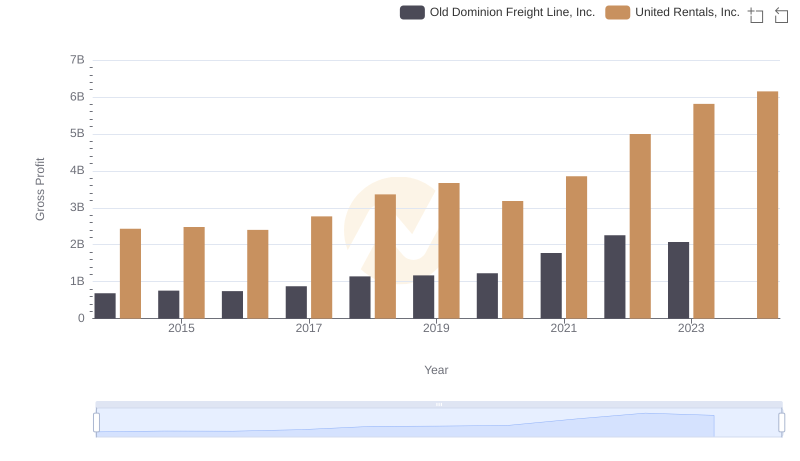
Gross Profit Comparison: United Rentals, Inc. and Old Dominion Freight Line, Inc. Trends
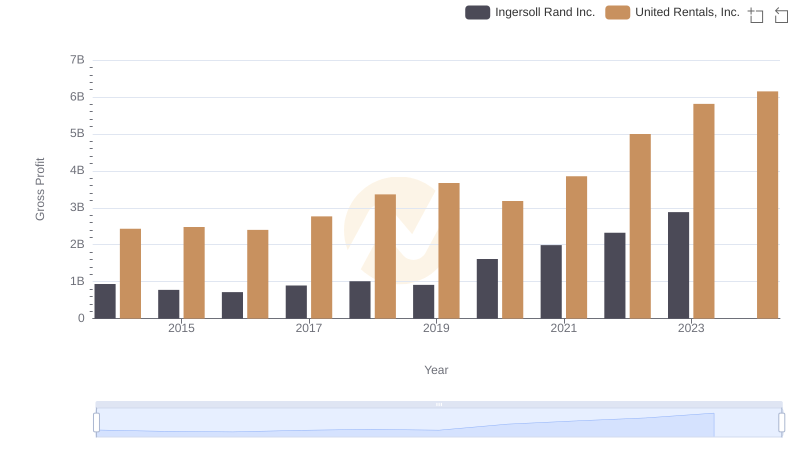
United Rentals, Inc. and Ingersoll Rand Inc.: A Detailed Gross Profit Analysis
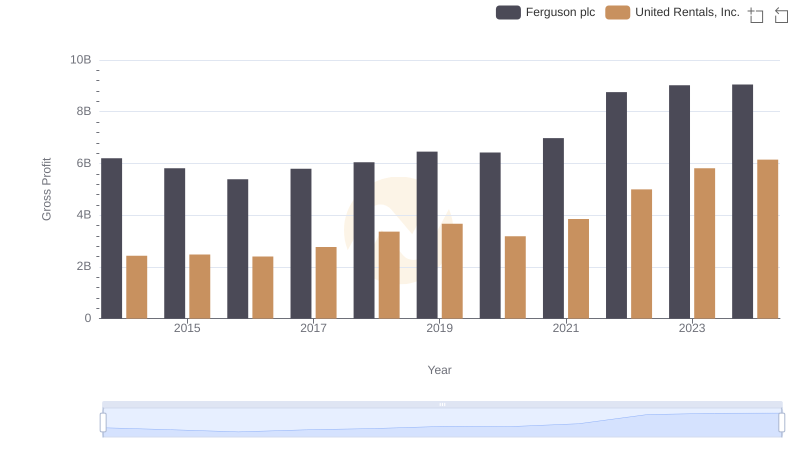
Key Insights on Gross Profit: United Rentals, Inc. vs Ferguson plc
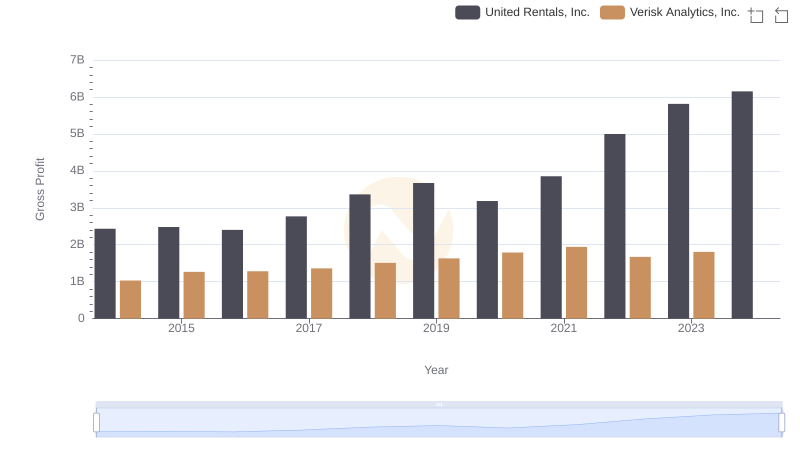
Gross Profit Trends Compared: United Rentals, Inc. vs Verisk Analytics, Inc.
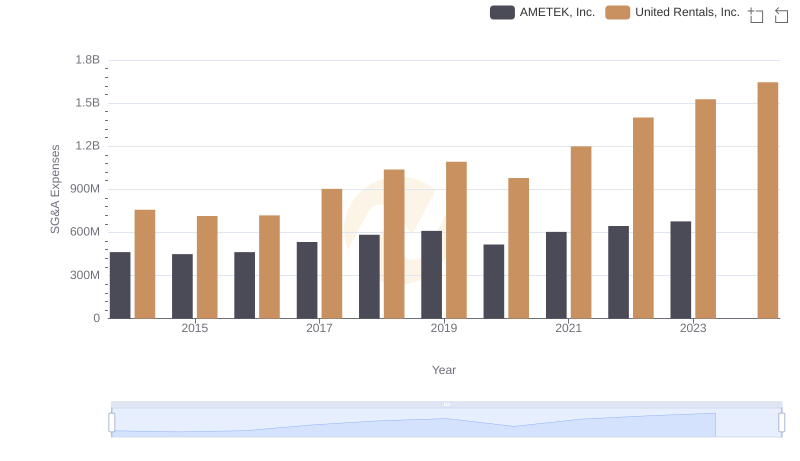
United Rentals, Inc. vs AMETEK, Inc.: SG&A Expense Trends
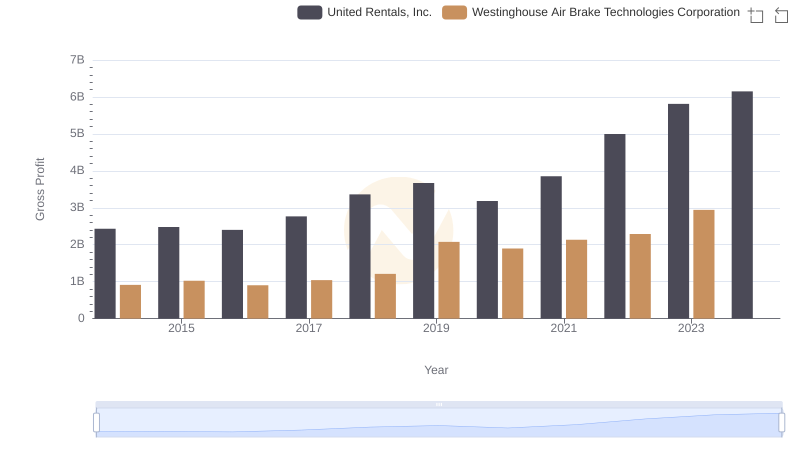
United Rentals, Inc. and Westinghouse Air Brake Technologies Corporation: A Detailed Gross Profit Analysis
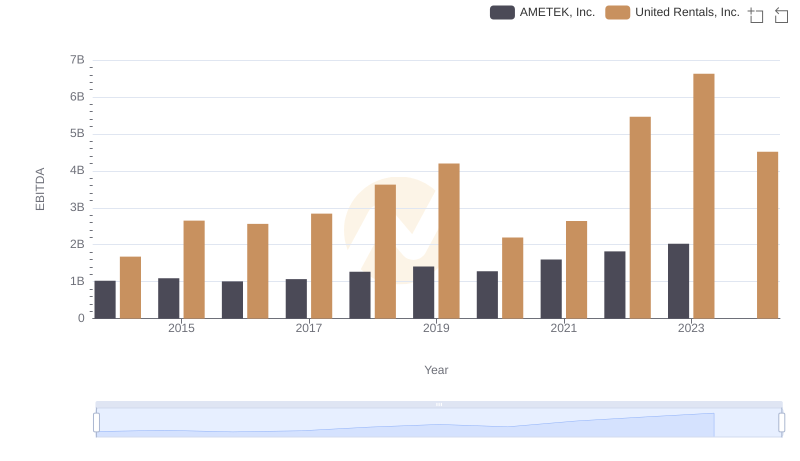
A Side-by-Side Analysis of EBITDA: United Rentals, Inc. and AMETEK, Inc.