| __timestamp | Rentokil Initial plc | United Airlines Holdings, Inc. |
|---|---|---|
| Wednesday, January 1, 2014 | 1740800000 | 38901000000 |
| Thursday, January 1, 2015 | 1759000000 | 37864000000 |
| Friday, January 1, 2016 | 2168100000 | 36556000000 |
| Sunday, January 1, 2017 | 2412300000 | 37736000000 |
| Monday, January 1, 2018 | 2472300000 | 41303000000 |
| Tuesday, January 1, 2019 | 2676200000 | 43259000000 |
| Wednesday, January 1, 2020 | 2789400000 | 15355000000 |
| Friday, January 1, 2021 | 2953900000 | 24634000000 |
| Saturday, January 1, 2022 | 3714000000 | 44955000000 |
| Sunday, January 1, 2023 | 5375000000 | 53717000000 |
| Monday, January 1, 2024 | 57063000000 |
Igniting the spark of knowledge
In the ever-evolving landscape of global business, revenue generation is a key indicator of a company's market strength. Over the past decade, United Airlines Holdings, Inc. and Rentokil Initial plc have showcased contrasting revenue trajectories. From 2014 to 2023, United Airlines consistently outperformed Rentokil, with revenues peaking at approximately $53.7 billion in 2023, a staggering 900% higher than Rentokil's $5.4 billion in the same year. However, Rentokil has demonstrated a steady growth trend, increasing its revenue by over 200% since 2014. The pandemic year of 2020 saw a significant dip for United Airlines, with revenues dropping to $15.4 billion, highlighting the industry's vulnerability to global disruptions. In contrast, Rentokil's revenue remained relatively stable, underscoring its resilience. This comparison not only highlights the scale of United Airlines but also Rentokil's consistent growth in a competitive market.
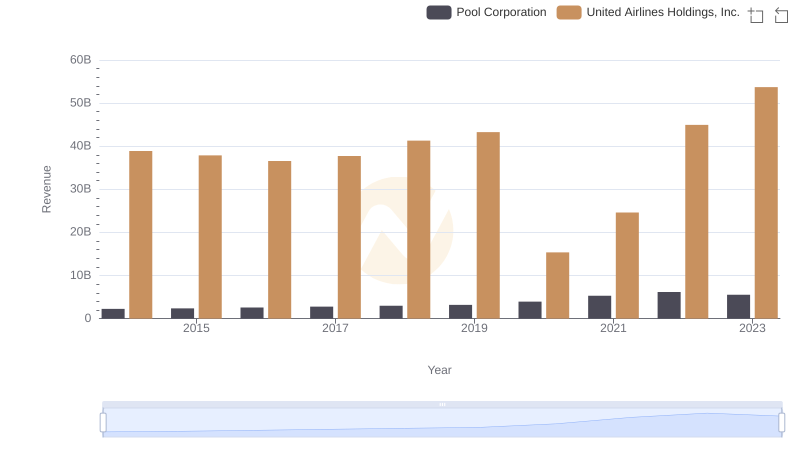
Revenue Showdown: United Airlines Holdings, Inc. vs Pool Corporation
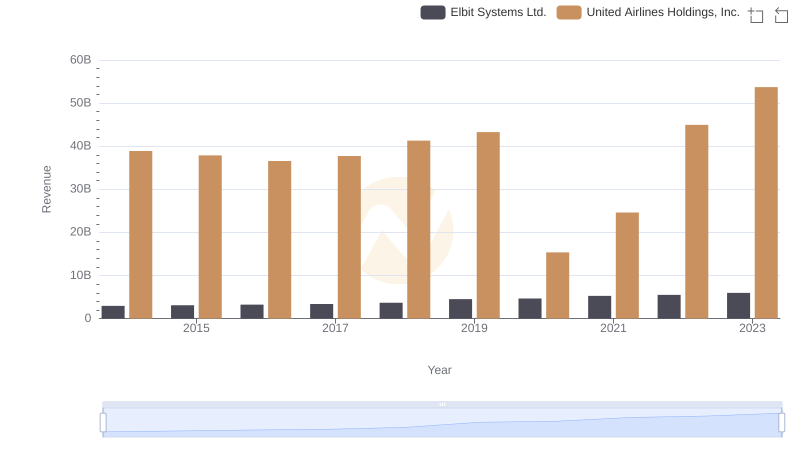
United Airlines Holdings, Inc. vs Elbit Systems Ltd.: Examining Key Revenue Metrics
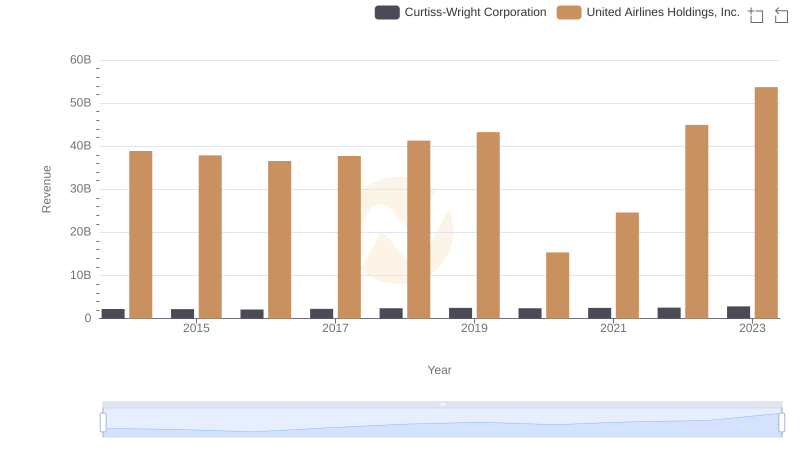
United Airlines Holdings, Inc. vs Curtiss-Wright Corporation: Annual Revenue Growth Compared
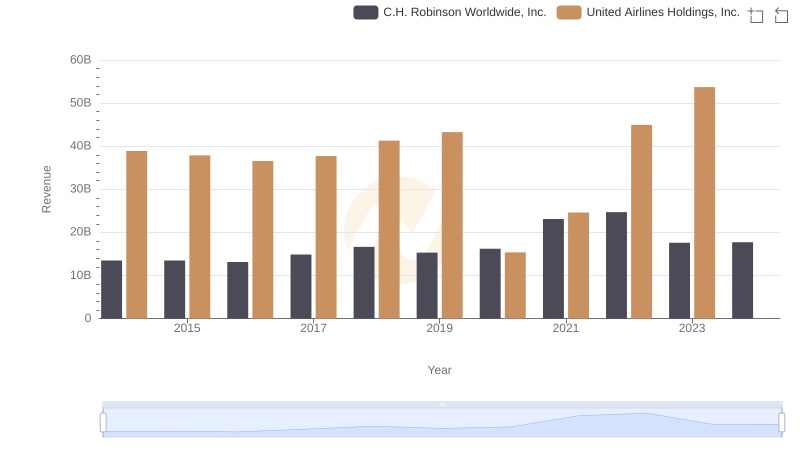
Comparing Revenue Performance: United Airlines Holdings, Inc. or C.H. Robinson Worldwide, Inc.?
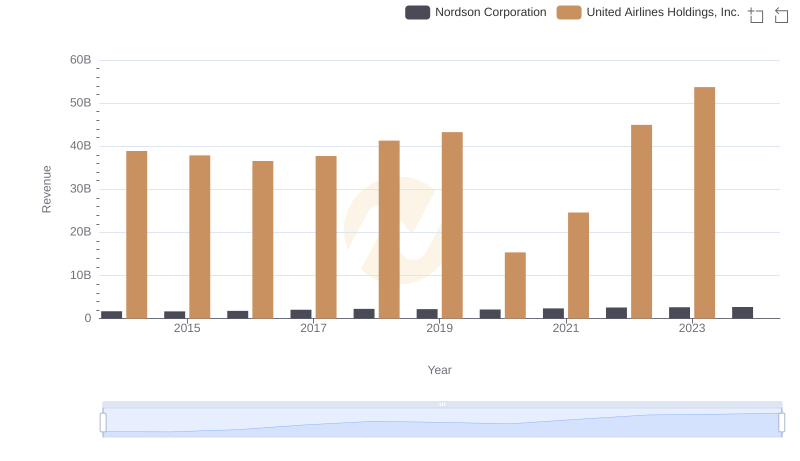
Revenue Insights: United Airlines Holdings, Inc. and Nordson Corporation Performance Compared
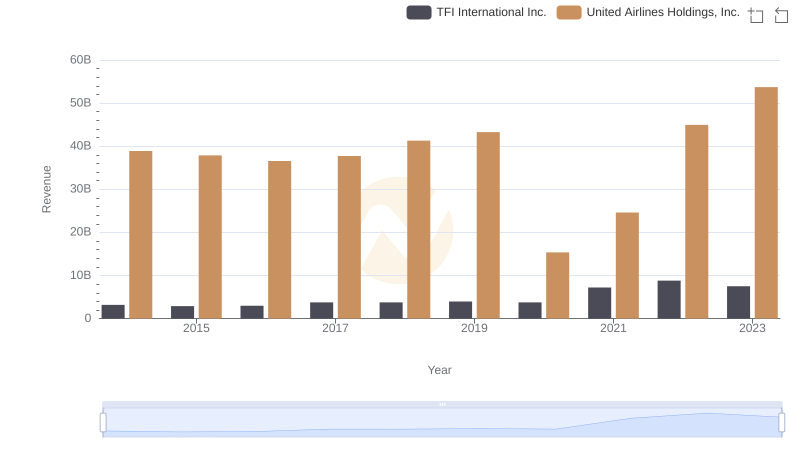
Who Generates More Revenue? United Airlines Holdings, Inc. or TFI International Inc.
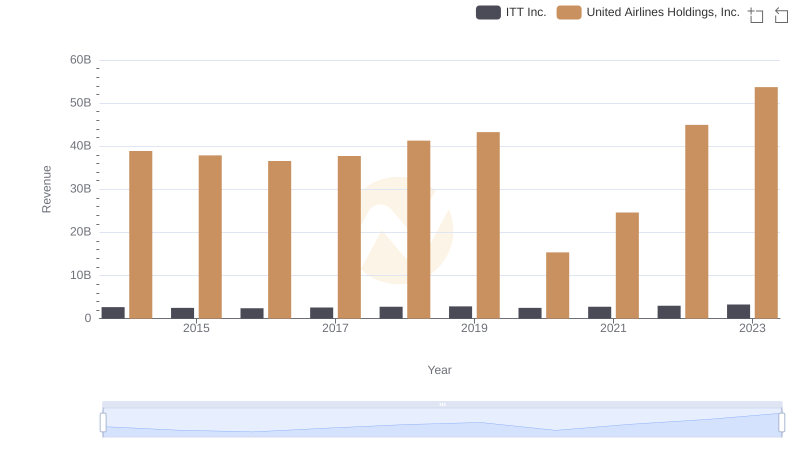
Revenue Showdown: United Airlines Holdings, Inc. vs ITT Inc.
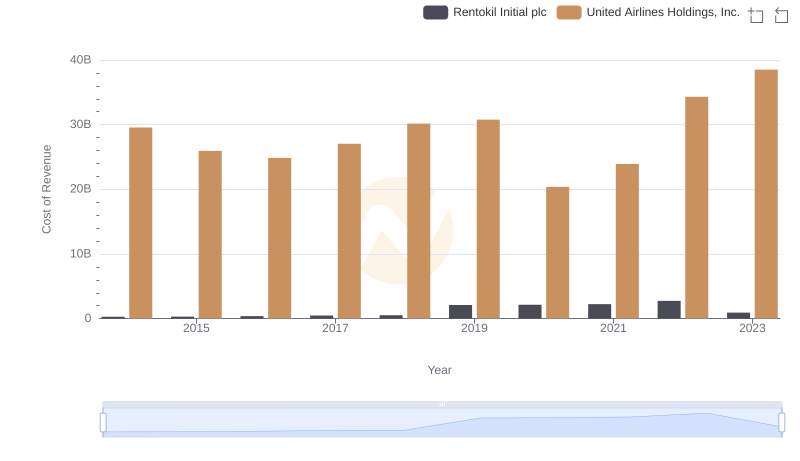
Comparing Cost of Revenue Efficiency: United Airlines Holdings, Inc. vs Rentokil Initial plc