| __timestamp | Nordson Corporation | United Airlines Holdings, Inc. |
|---|---|---|
| Wednesday, January 1, 2014 | 1704021000 | 38901000000 |
| Thursday, January 1, 2015 | 1688666000 | 37864000000 |
| Friday, January 1, 2016 | 1808994000 | 36556000000 |
| Sunday, January 1, 2017 | 2066982000 | 37736000000 |
| Monday, January 1, 2018 | 2254668000 | 41303000000 |
| Tuesday, January 1, 2019 | 2194226000 | 43259000000 |
| Wednesday, January 1, 2020 | 2121100000 | 15355000000 |
| Friday, January 1, 2021 | 2362209000 | 24634000000 |
| Saturday, January 1, 2022 | 2590278000 | 44955000000 |
| Sunday, January 1, 2023 | 2628632000 | 53717000000 |
| Monday, January 1, 2024 | 2689921000 | 57063000000 |
Unleashing insights
In the ever-evolving landscape of American business, the revenue trajectories of United Airlines Holdings, Inc. and Nordson Corporation offer a fascinating glimpse into the resilience and adaptability of two distinct industries. From 2014 to 2023, United Airlines experienced a rollercoaster of revenue changes, with a notable dip in 2020, reflecting the global travel disruptions. However, by 2023, the airline's revenue soared by approximately 250% from its 2020 low, showcasing a robust recovery.
Conversely, Nordson Corporation, a leader in precision technology, demonstrated steady growth over the same period. Its revenue increased by about 58% from 2014 to 2023, highlighting consistent demand for its products. The data for 2024 remains incomplete, leaving room for speculation on future trends. This comparison underscores the dynamic nature of revenue generation across different sectors, emphasizing the importance of strategic adaptation in the face of global challenges.
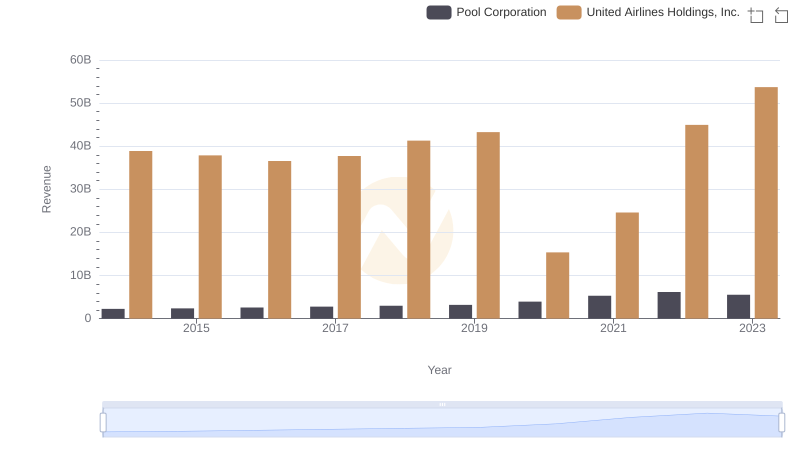
Revenue Showdown: United Airlines Holdings, Inc. vs Pool Corporation

United Airlines Holdings, Inc. vs Elbit Systems Ltd.: Examining Key Revenue Metrics
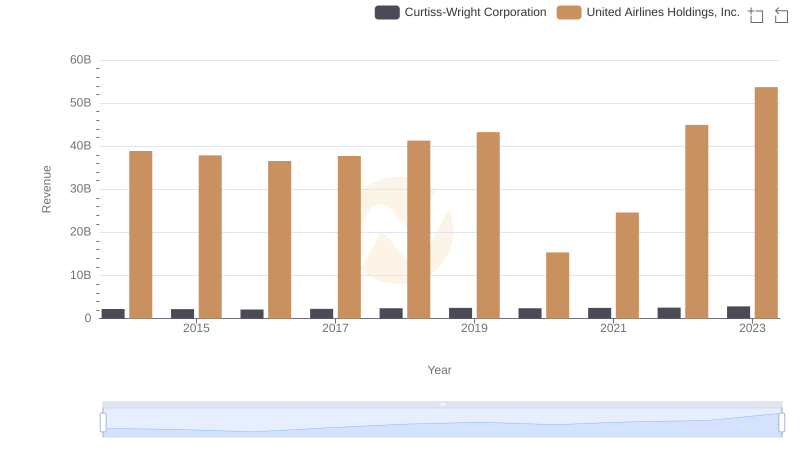
United Airlines Holdings, Inc. vs Curtiss-Wright Corporation: Annual Revenue Growth Compared
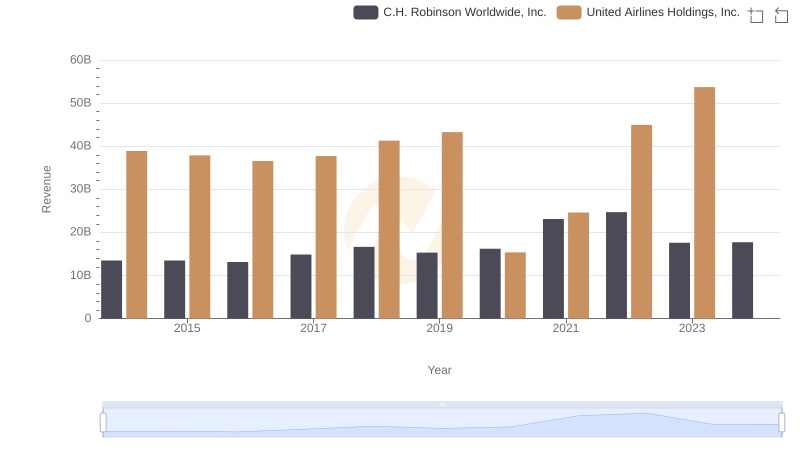
Comparing Revenue Performance: United Airlines Holdings, Inc. or C.H. Robinson Worldwide, Inc.?
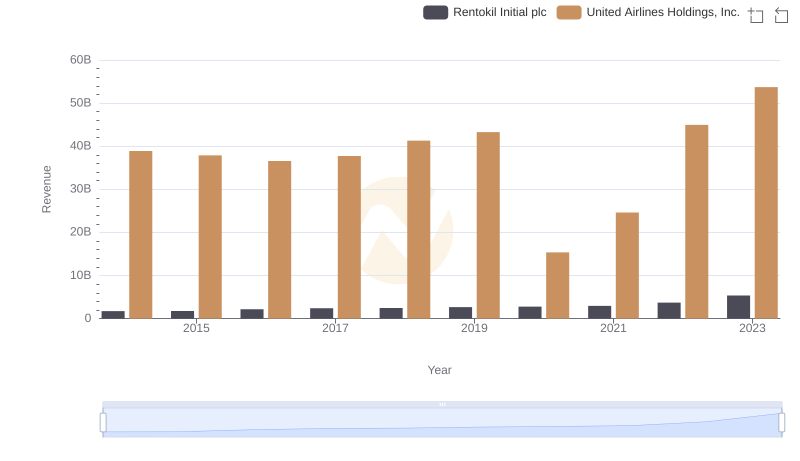
Who Generates More Revenue? United Airlines Holdings, Inc. or Rentokil Initial plc
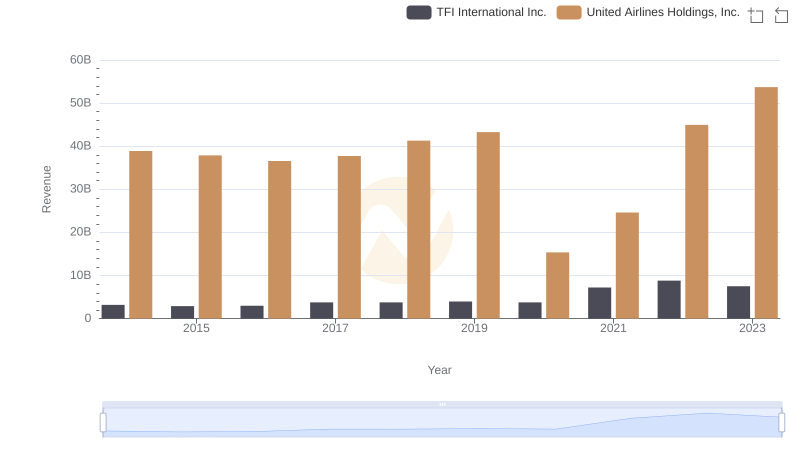
Who Generates More Revenue? United Airlines Holdings, Inc. or TFI International Inc.
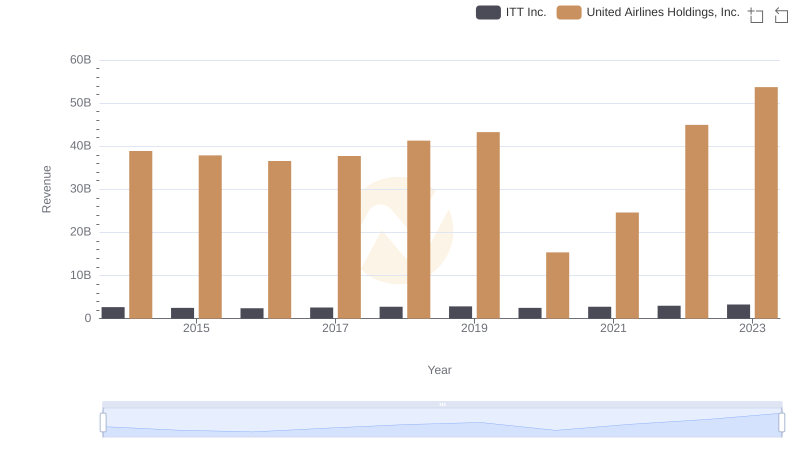
Revenue Showdown: United Airlines Holdings, Inc. vs ITT Inc.
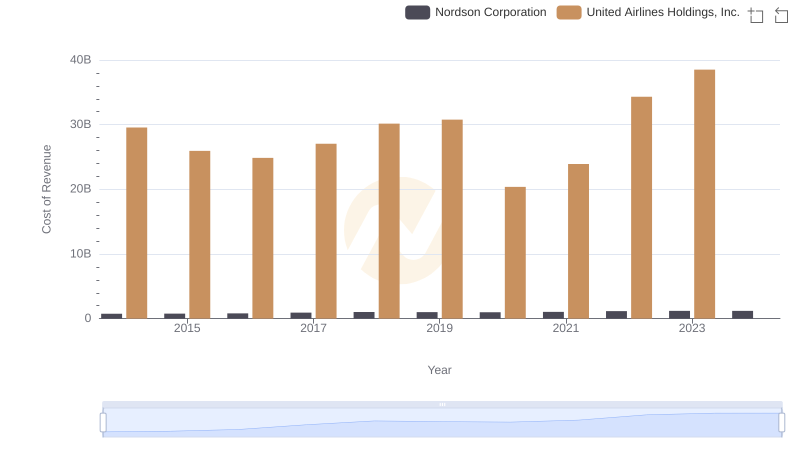
Comparing Cost of Revenue Efficiency: United Airlines Holdings, Inc. vs Nordson Corporation