| __timestamp | Atlassian Corporation | Intuit Inc. |
|---|---|---|
| Wednesday, January 1, 2014 | 37986000 | 668000000 |
| Thursday, January 1, 2015 | 52932000 | 725000000 |
| Friday, January 1, 2016 | 75783000 | 752000000 |
| Sunday, January 1, 2017 | 119161000 | 809000000 |
| Monday, January 1, 2018 | 172690000 | 977000000 |
| Tuesday, January 1, 2019 | 210285000 | 1167000000 |
| Wednesday, January 1, 2020 | 268807000 | 1378000000 |
| Friday, January 1, 2021 | 336021000 | 1683000000 |
| Saturday, January 1, 2022 | 465707000 | 2406000000 |
| Sunday, January 1, 2023 | 633765000 | 3143000000 |
| Monday, January 1, 2024 | 803495000 | 3465000000 |
Igniting the spark of knowledge
In the ever-evolving landscape of technology, understanding the cost dynamics of leading companies is crucial. This analysis delves into the cost of revenue trends for Intuit Inc. and Atlassian Corporation from 2014 to 2024. Over this decade, Intuit Inc. has consistently outpaced Atlassian in terms of cost of revenue, reflecting its expansive operations and market reach. By 2023, Intuit's cost of revenue surged to approximately 3.1 billion, marking a 370% increase from 2014. In contrast, Atlassian's cost of revenue grew by over 1,500%, reaching around 803 million in 2024. This stark contrast highlights Atlassian's rapid growth trajectory, albeit from a smaller base. As both companies continue to innovate, these financial insights offer a glimpse into their strategic priorities and operational efficiencies.
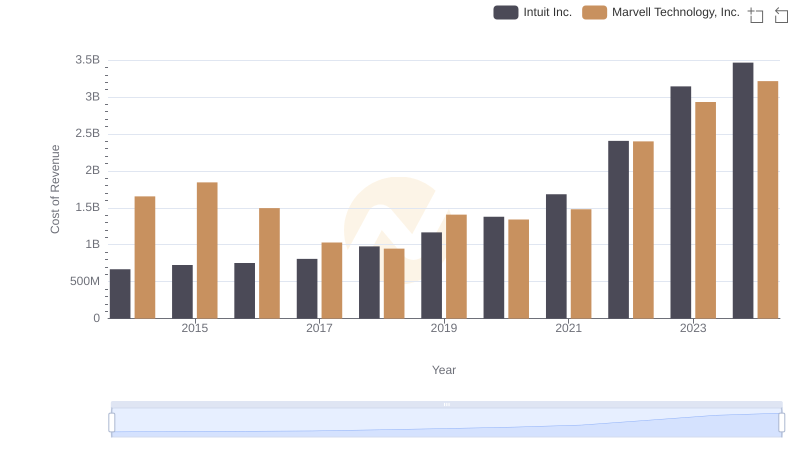
Cost of Revenue Comparison: Intuit Inc. vs Marvell Technology, Inc.
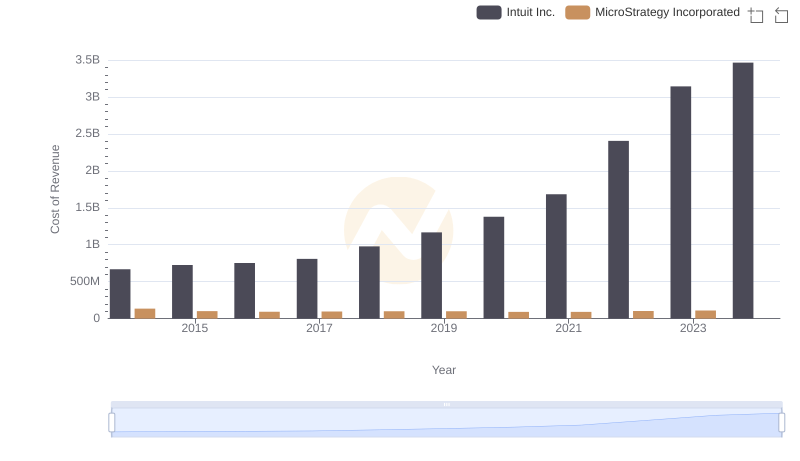
Analyzing Cost of Revenue: Intuit Inc. and MicroStrategy Incorporated
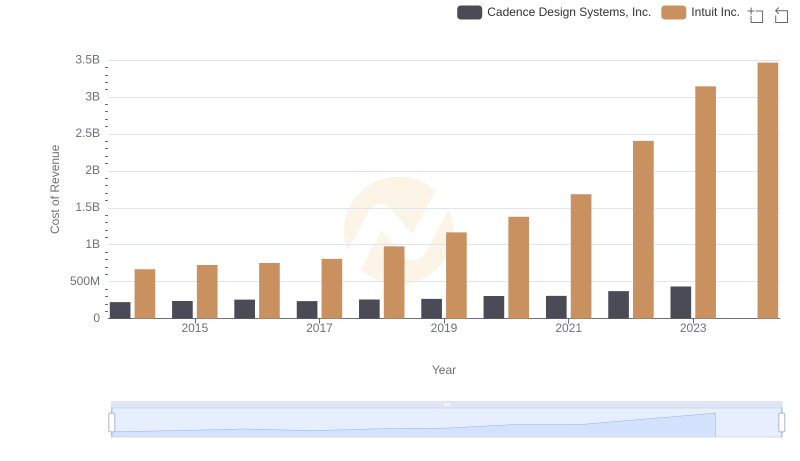
Cost of Revenue Trends: Intuit Inc. vs Cadence Design Systems, Inc.
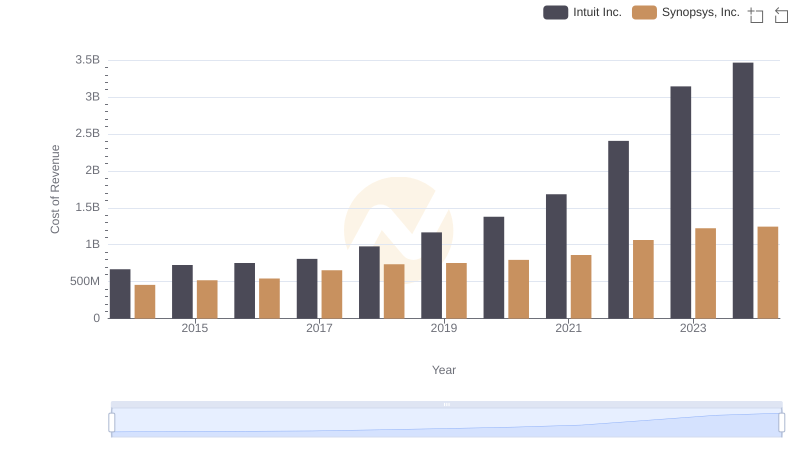
Comparing Cost of Revenue Efficiency: Intuit Inc. vs Synopsys, Inc.
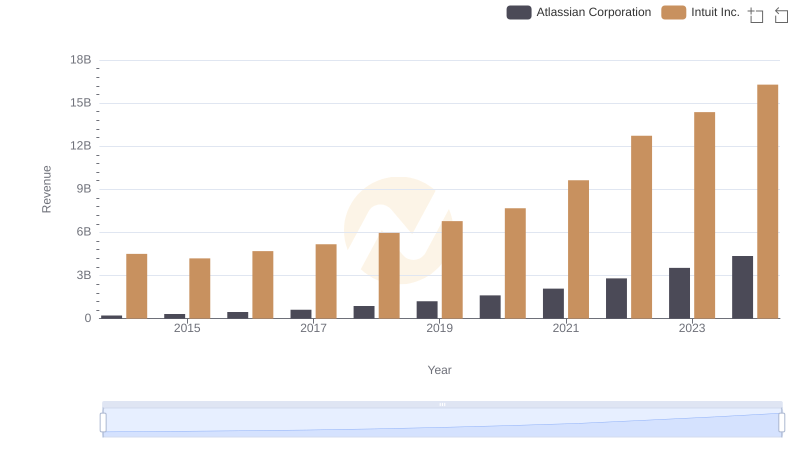
Who Generates More Revenue? Intuit Inc. or Atlassian Corporation
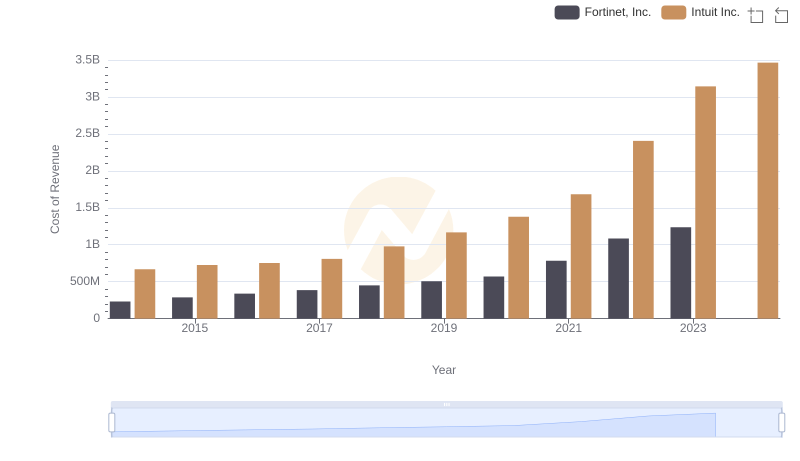
Comparing Cost of Revenue Efficiency: Intuit Inc. vs Fortinet, Inc.
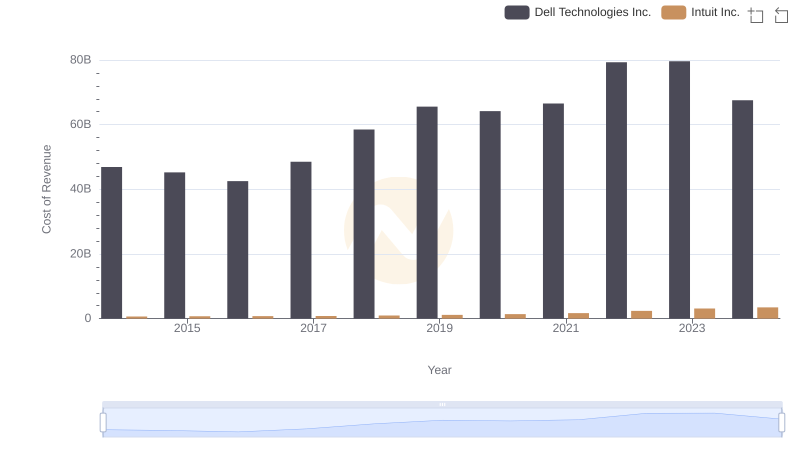
Cost of Revenue: Key Insights for Intuit Inc. and Dell Technologies Inc.
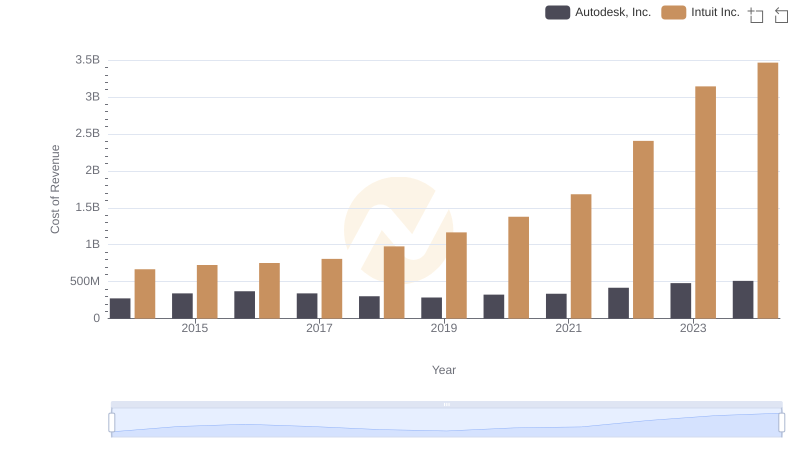
Cost of Revenue: Key Insights for Intuit Inc. and Autodesk, Inc.
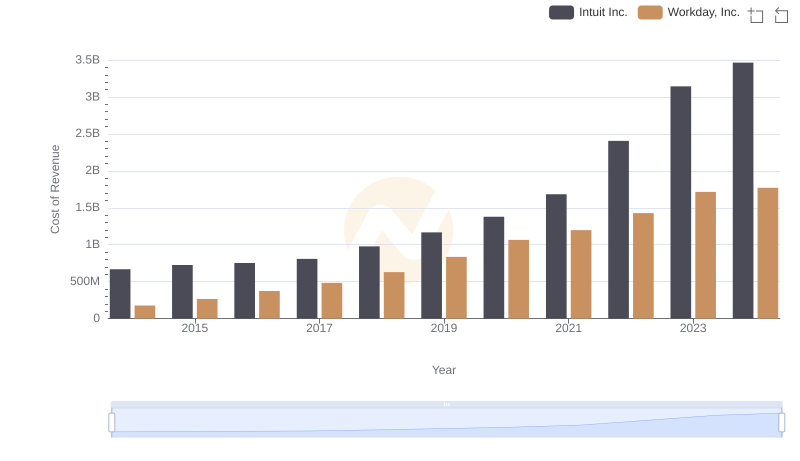
Comparing Cost of Revenue Efficiency: Intuit Inc. vs Workday, Inc.
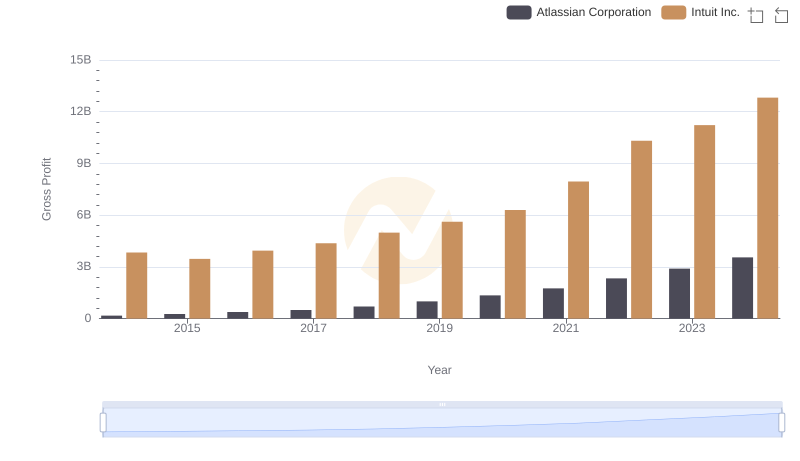
Gross Profit Analysis: Comparing Intuit Inc. and Atlassian Corporation
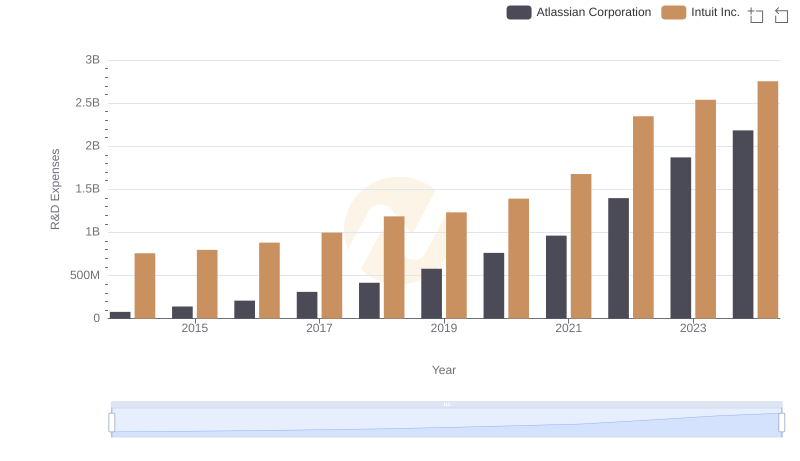
R&D Insights: How Intuit Inc. and Atlassian Corporation Allocate Funds
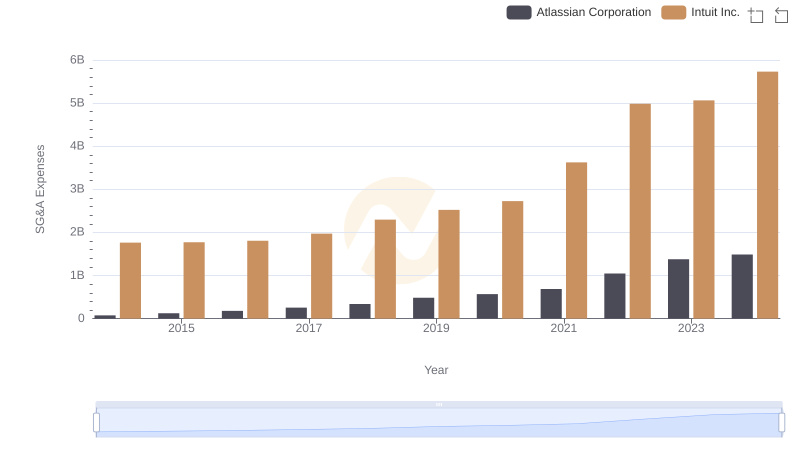
Who Optimizes SG&A Costs Better? Intuit Inc. or Atlassian Corporation