| __timestamp | American Airlines Group Inc. | Cintas Corporation |
|---|---|---|
| Wednesday, January 1, 2014 | 31939000000 | 2637426000 |
| Thursday, January 1, 2015 | 27967000000 | 2555549000 |
| Friday, January 1, 2016 | 28339000000 | 2775588000 |
| Sunday, January 1, 2017 | 31154000000 | 2943086000 |
| Monday, January 1, 2018 | 34490000000 | 3568109000 |
| Tuesday, January 1, 2019 | 35379000000 | 3763715000 |
| Wednesday, January 1, 2020 | 24933000000 | 3851372000 |
| Friday, January 1, 2021 | 29855000000 | 3801689000 |
| Saturday, January 1, 2022 | 39934000000 | 4222213000 |
| Sunday, January 1, 2023 | 40978000000 | 4642401000 |
| Monday, January 1, 2024 | 4910199000 |
In pursuit of knowledge
In the ever-evolving landscape of American business, the cost of revenue is a critical metric that reflects operational efficiency. This analysis juxtaposes two giants from distinct sectors: Cintas Corporation, a leader in corporate uniforms and facility services, and American Airlines Group Inc., a titan of the aviation industry.
From 2014 to 2023, Cintas Corporation demonstrated a steady increase in cost efficiency, with its cost of revenue rising by approximately 86%, from $2.6 billion to $4.6 billion. In contrast, American Airlines experienced a more volatile trajectory, with a 28% increase, peaking at $41 billion in 2023. Notably, 2020 marked a significant dip for American Airlines, reflecting the pandemic's impact on travel.
This comparison underscores the resilience of Cintas' business model, even as American Airlines navigates the turbulent skies of the aviation sector.
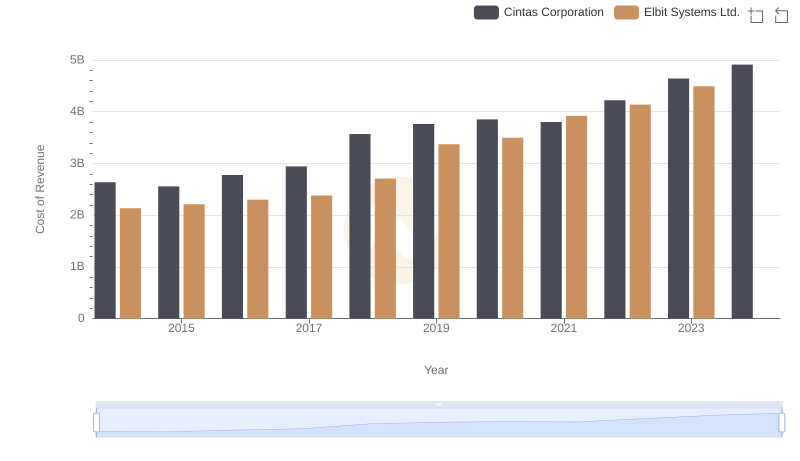
Analyzing Cost of Revenue: Cintas Corporation and Elbit Systems Ltd.
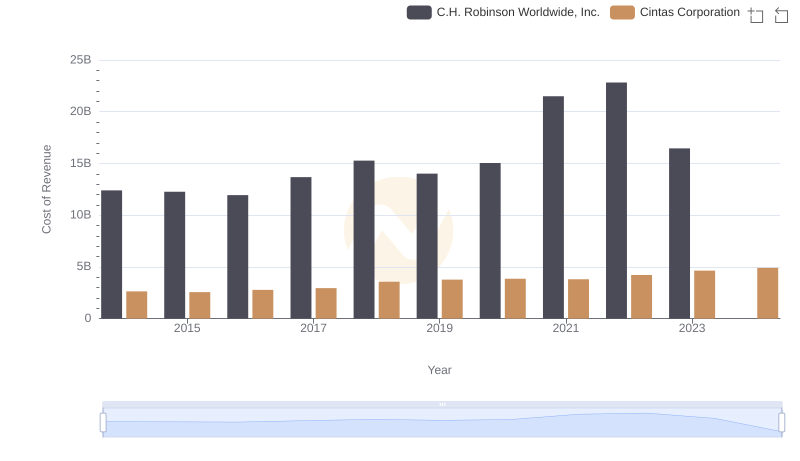
Cost of Revenue Trends: Cintas Corporation vs C.H. Robinson Worldwide, Inc.
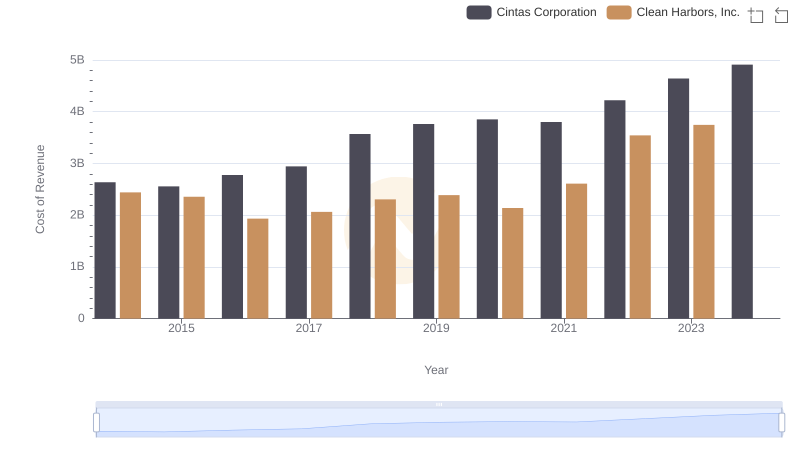
Analyzing Cost of Revenue: Cintas Corporation and Clean Harbors, Inc.
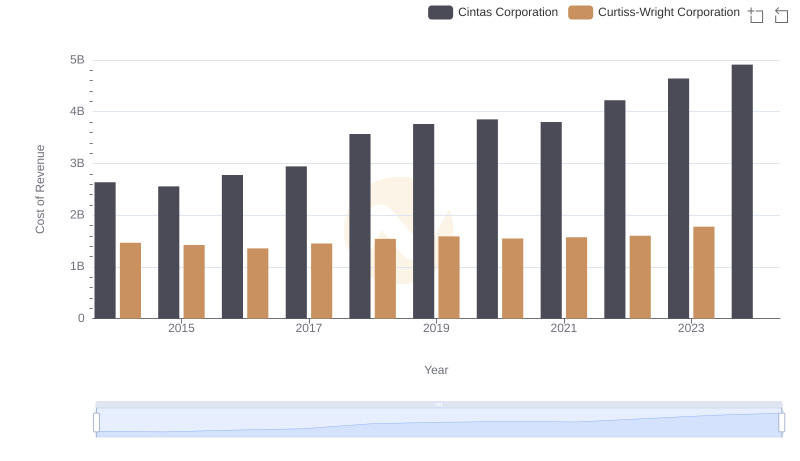
Cost of Revenue Comparison: Cintas Corporation vs Curtiss-Wright Corporation
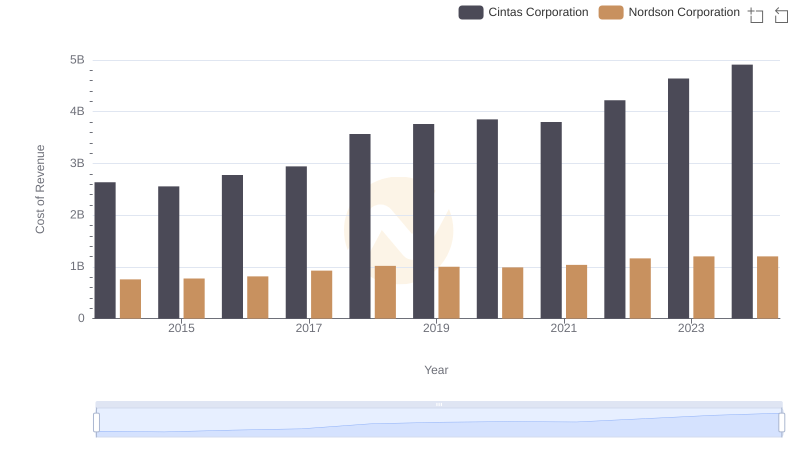
Comparing Cost of Revenue Efficiency: Cintas Corporation vs Nordson Corporation
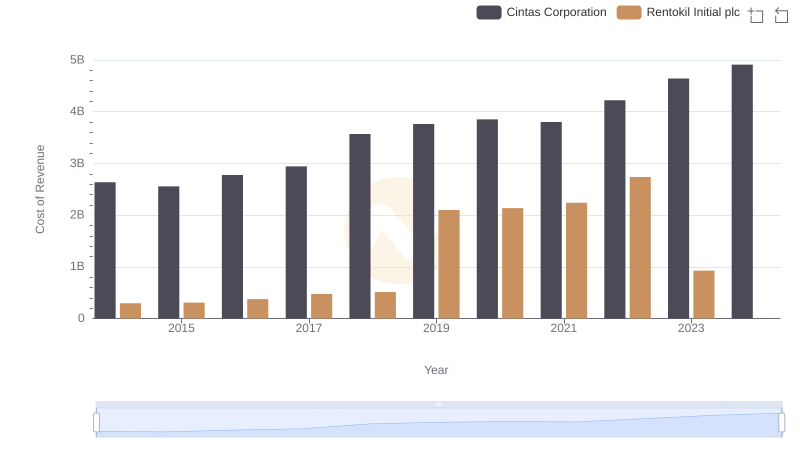
Cintas Corporation vs Rentokil Initial plc: Efficiency in Cost of Revenue Explored
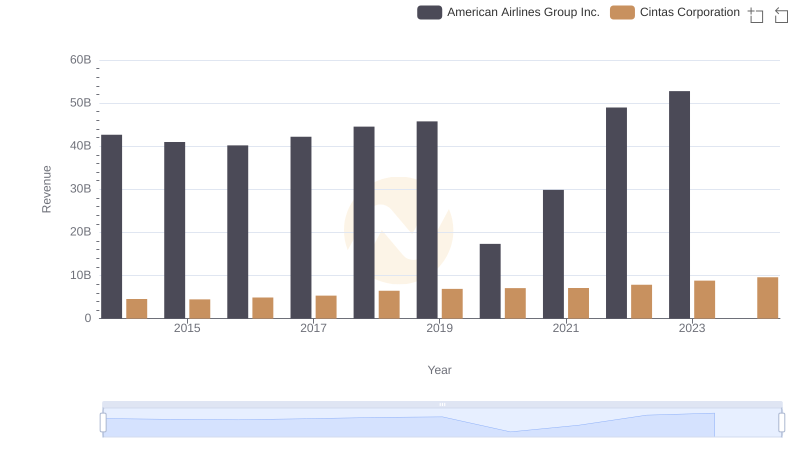
Revenue Showdown: Cintas Corporation vs American Airlines Group Inc.
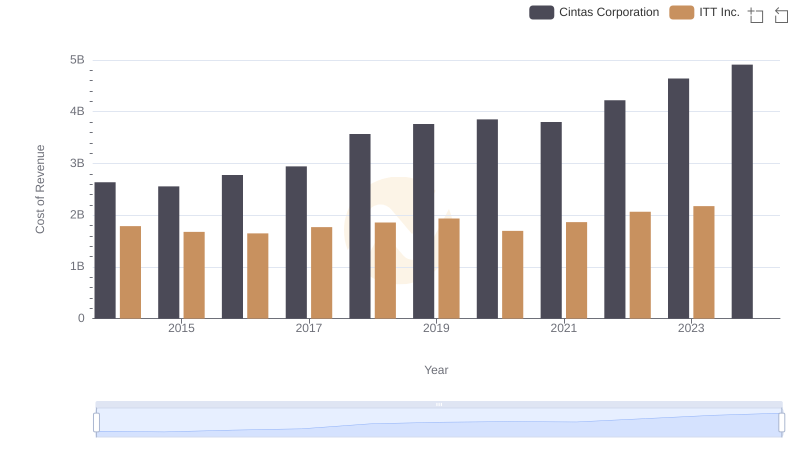
Cost Insights: Breaking Down Cintas Corporation and ITT Inc.'s Expenses
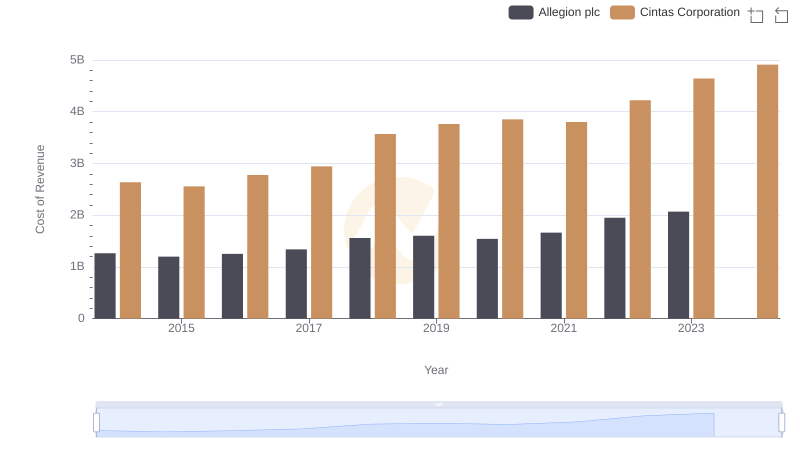
Analyzing Cost of Revenue: Cintas Corporation and Allegion plc
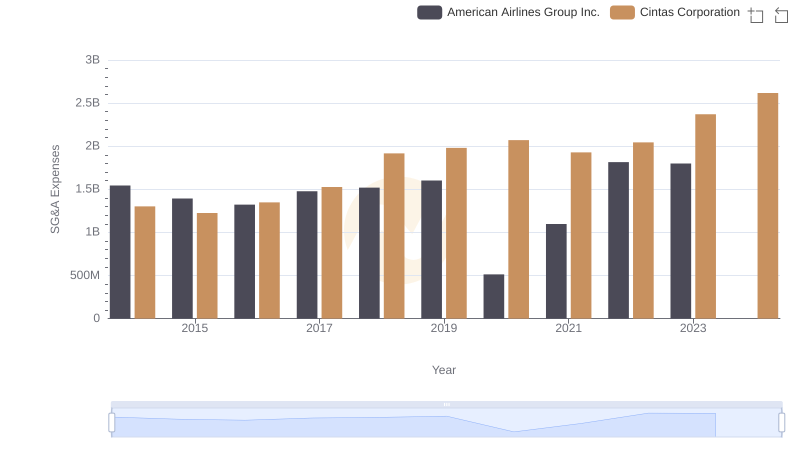
Cintas Corporation or American Airlines Group Inc.: Who Manages SG&A Costs Better?