| __timestamp | Cintas Corporation | Rentokil Initial plc |
|---|---|---|
| Wednesday, January 1, 2014 | 2637426000 | 297500000 |
| Thursday, January 1, 2015 | 2555549000 | 310200000 |
| Friday, January 1, 2016 | 2775588000 | 376100000 |
| Sunday, January 1, 2017 | 2943086000 | 474900000 |
| Monday, January 1, 2018 | 3568109000 | 514200000 |
| Tuesday, January 1, 2019 | 3763715000 | 2099000000 |
| Wednesday, January 1, 2020 | 3851372000 | 2136400000 |
| Friday, January 1, 2021 | 3801689000 | 2239100000 |
| Saturday, January 1, 2022 | 4222213000 | 2737000000 |
| Sunday, January 1, 2023 | 4642401000 | 927000000 |
| Monday, January 1, 2024 | 4910199000 |
Unleashing the power of data
In the competitive landscape of business services, cost efficiency is paramount. This analysis delves into the cost of revenue trends for Cintas Corporation and Rentokil Initial plc from 2014 to 2023. Over this period, Cintas consistently demonstrated robust growth, with its cost of revenue increasing by approximately 86%, from $2.64 billion in 2014 to $4.91 billion in 2023. In contrast, Rentokil Initial plc experienced a more volatile trajectory, peaking in 2022 with a cost of revenue of $2.74 billion before a significant drop to $927 million in 2023. This fluctuation highlights the challenges Rentokil faces in maintaining cost efficiency. The data suggests that while Cintas has steadily optimized its operations, Rentokil's recent decline may indicate strategic shifts or market pressures. Understanding these dynamics is crucial for investors and stakeholders aiming to navigate the evolving business services sector.
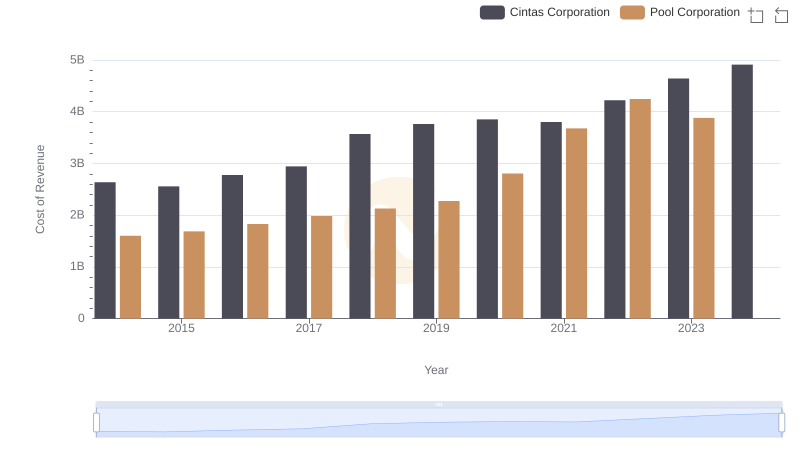
Cost of Revenue: Key Insights for Cintas Corporation and Pool Corporation
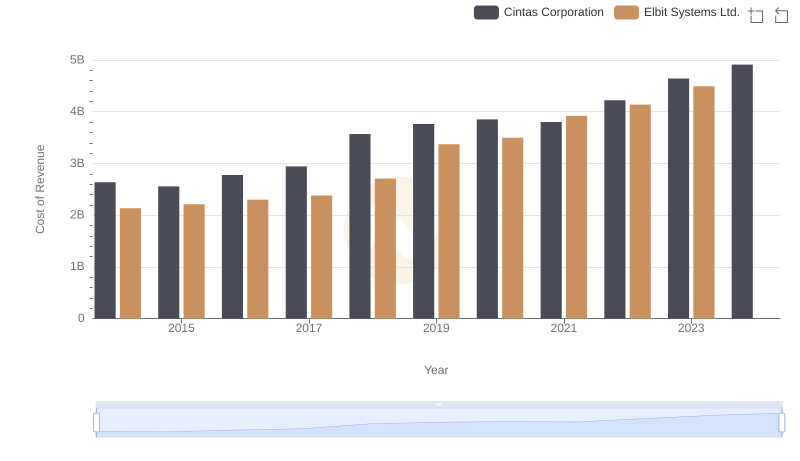
Analyzing Cost of Revenue: Cintas Corporation and Elbit Systems Ltd.
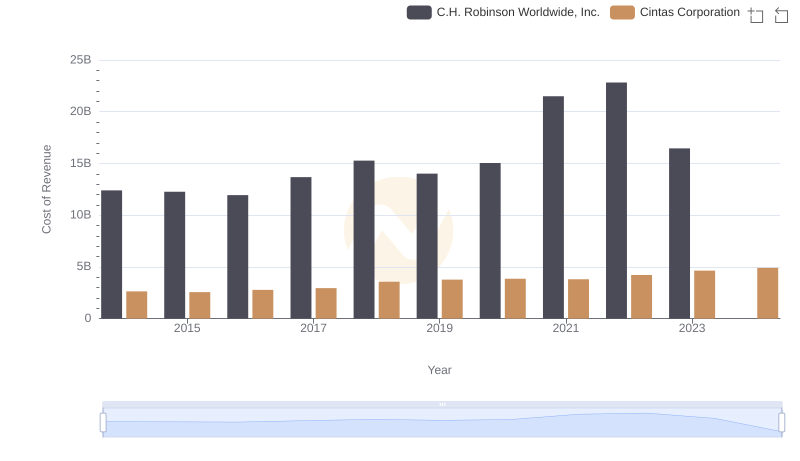
Cost of Revenue Trends: Cintas Corporation vs C.H. Robinson Worldwide, Inc.
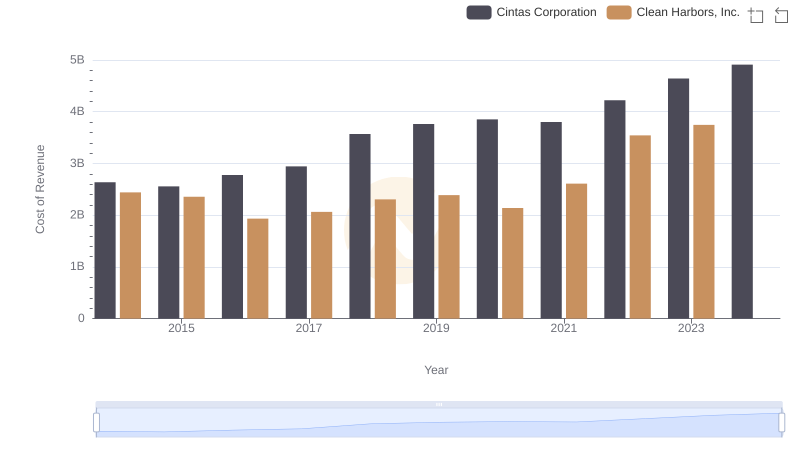
Analyzing Cost of Revenue: Cintas Corporation and Clean Harbors, Inc.
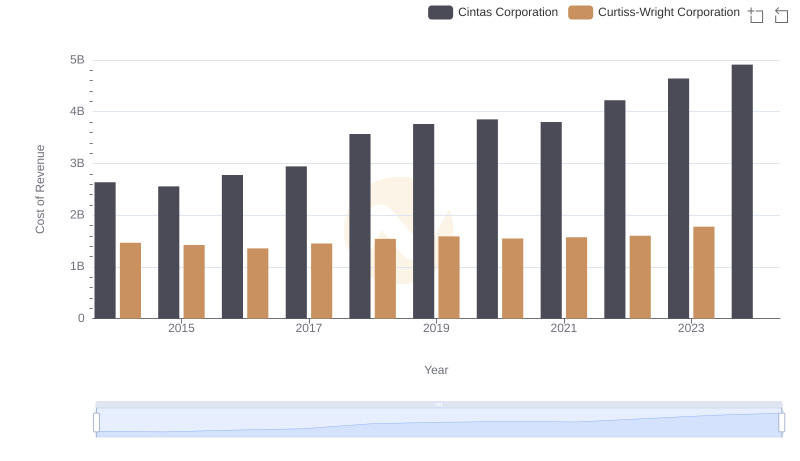
Cost of Revenue Comparison: Cintas Corporation vs Curtiss-Wright Corporation
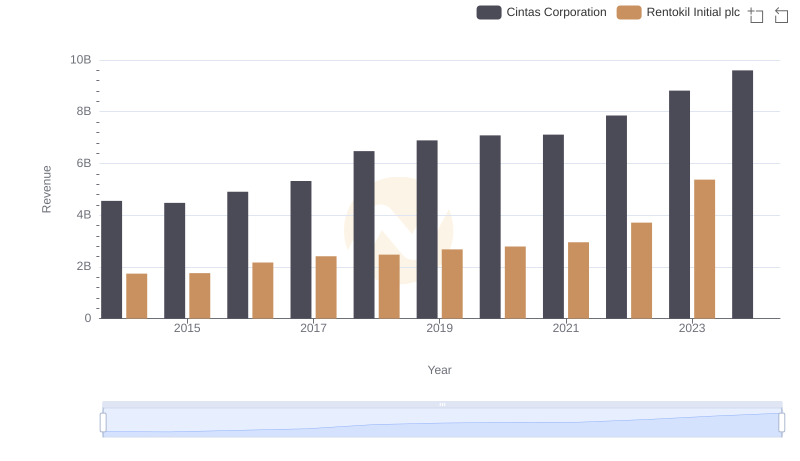
Cintas Corporation vs Rentokil Initial plc: Annual Revenue Growth Compared
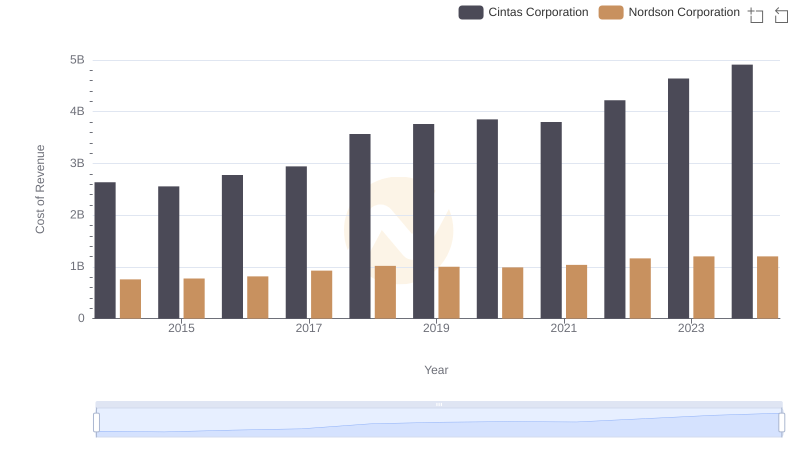
Comparing Cost of Revenue Efficiency: Cintas Corporation vs Nordson Corporation
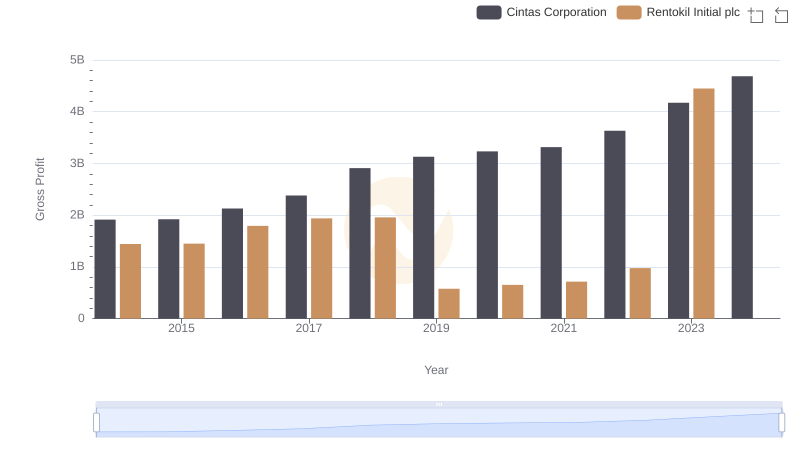
Gross Profit Trends Compared: Cintas Corporation vs Rentokil Initial plc
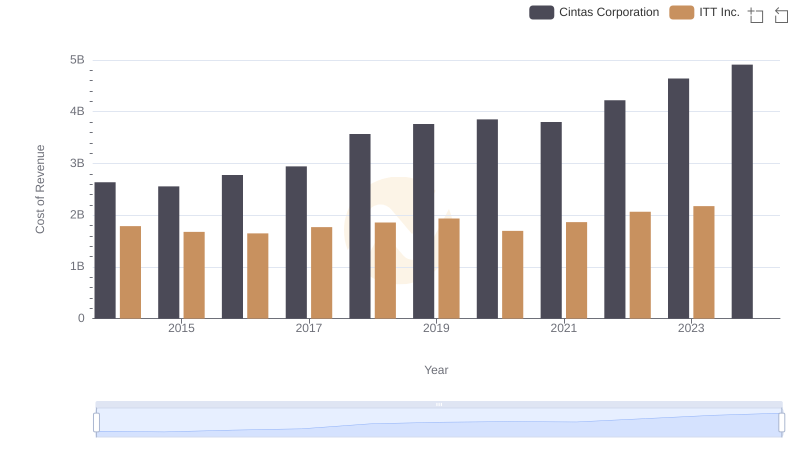
Cost Insights: Breaking Down Cintas Corporation and ITT Inc.'s Expenses
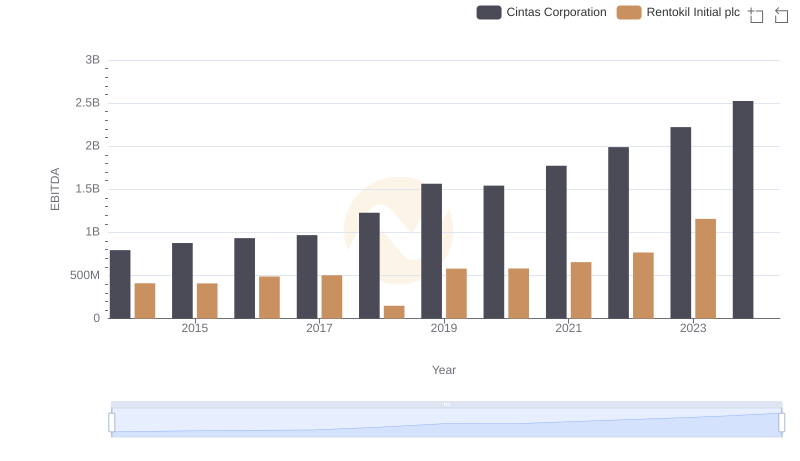
Comparative EBITDA Analysis: Cintas Corporation vs Rentokil Initial plc