| __timestamp | American Airlines Group Inc. | Cintas Corporation |
|---|---|---|
| Wednesday, January 1, 2014 | 42650000000 | 4551812000 |
| Thursday, January 1, 2015 | 40990000000 | 4476886000 |
| Friday, January 1, 2016 | 40180000000 | 4905458000 |
| Sunday, January 1, 2017 | 42207000000 | 5323381000 |
| Monday, January 1, 2018 | 44541000000 | 6476632000 |
| Tuesday, January 1, 2019 | 45768000000 | 6892303000 |
| Wednesday, January 1, 2020 | 17337000000 | 7085120000 |
| Friday, January 1, 2021 | 29882000000 | 7116340000 |
| Saturday, January 1, 2022 | 48971000000 | 7854459000 |
| Sunday, January 1, 2023 | 52788000000 | 8815769000 |
| Monday, January 1, 2024 | 9596615000 |
Igniting the spark of knowledge
In the ever-evolving landscape of American business, two giants stand out: Cintas Corporation and American Airlines Group Inc. Over the past decade, these companies have showcased contrasting revenue trajectories. From 2014 to 2023, American Airlines experienced a rollercoaster ride, with revenues plummeting by nearly 60% in 2020 due to the pandemic, only to soar back by 204% in 2023. Meanwhile, Cintas Corporation displayed a steady ascent, with revenues growing by approximately 94% over the same period.
This comparison highlights the resilience of Cintas, a leader in corporate identity uniforms, against the volatile airline industry. As we look to 2024, Cintas continues its upward trend, while American Airlines' data remains elusive. This revenue showdown underscores the diverse challenges and triumphs faced by these industry titans.
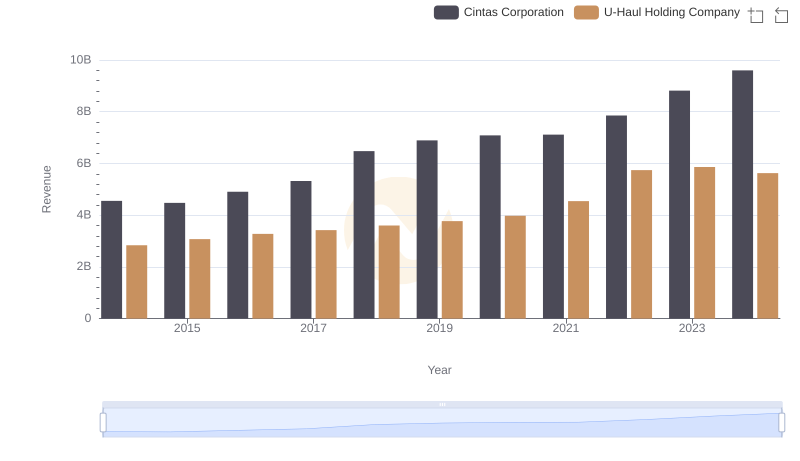
Who Generates More Revenue? Cintas Corporation or U-Haul Holding Company
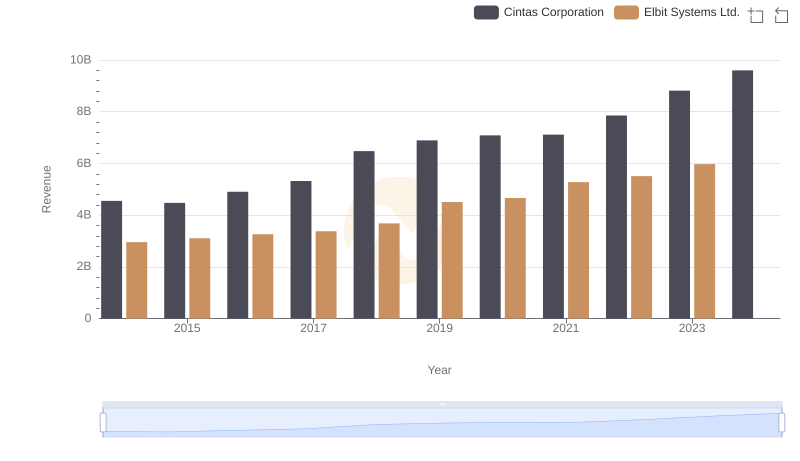
Who Generates More Revenue? Cintas Corporation or Elbit Systems Ltd.
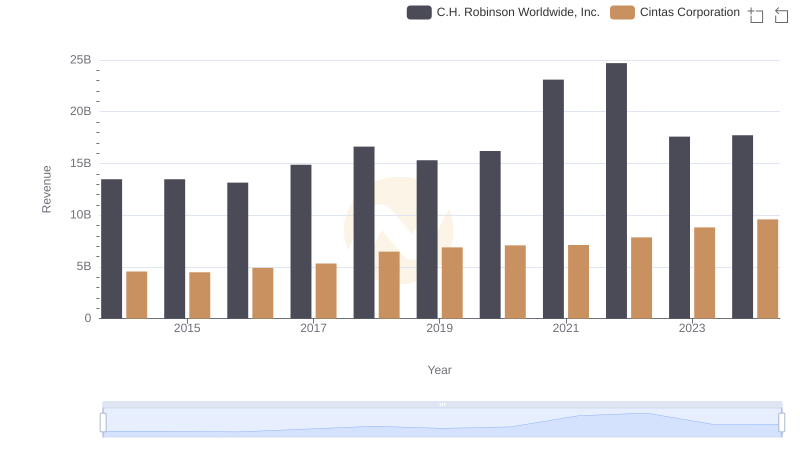
Revenue Showdown: Cintas Corporation vs C.H. Robinson Worldwide, Inc.
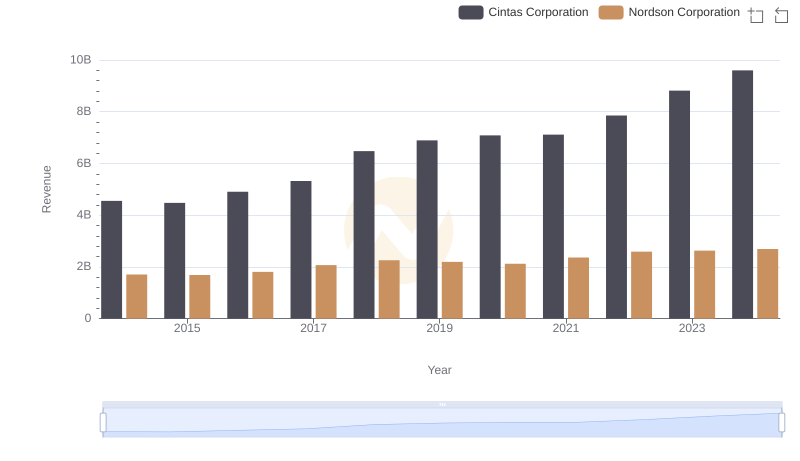
Cintas Corporation vs Nordson Corporation: Annual Revenue Growth Compared
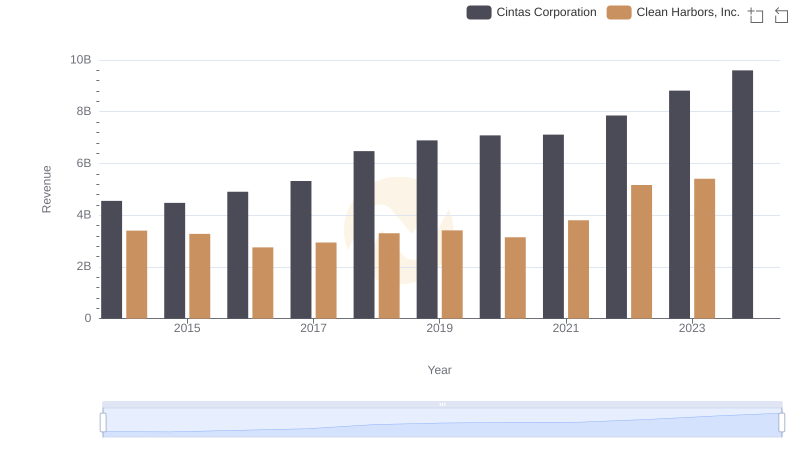
Revenue Insights: Cintas Corporation and Clean Harbors, Inc. Performance Compared
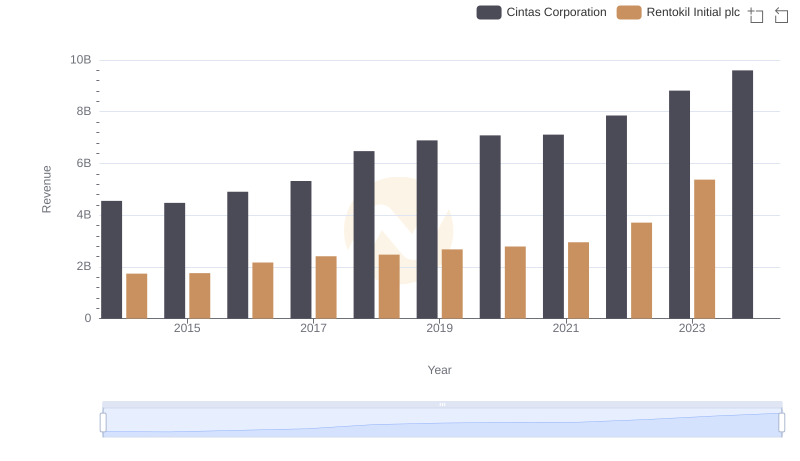
Cintas Corporation vs Rentokil Initial plc: Annual Revenue Growth Compared
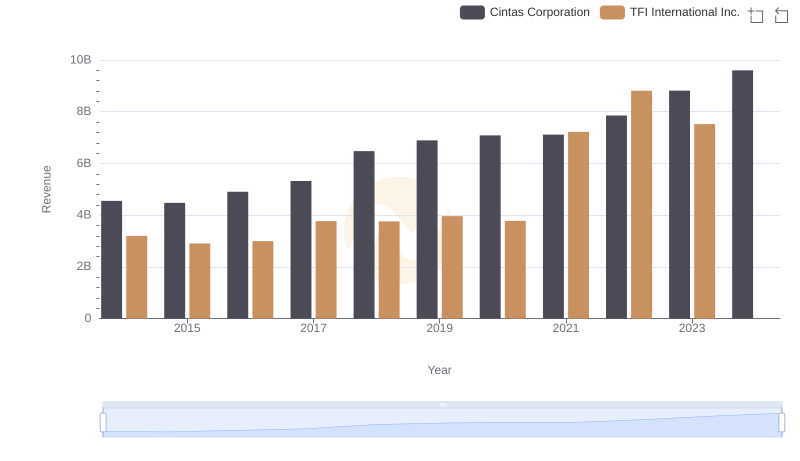
Cintas Corporation vs TFI International Inc.: Annual Revenue Growth Compared
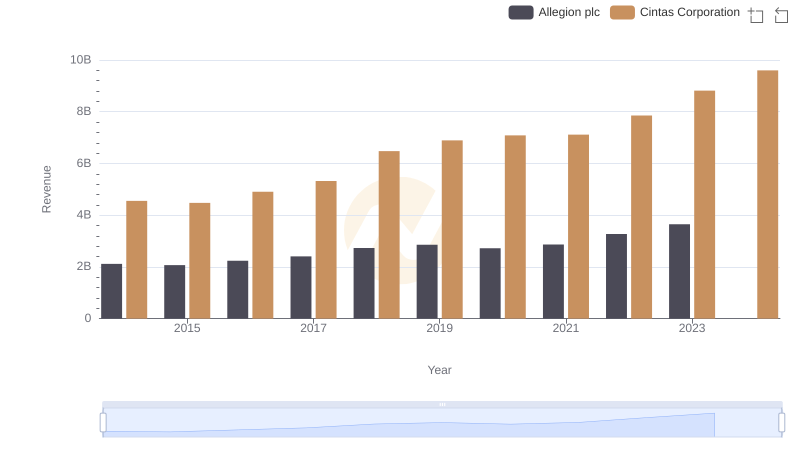
Annual Revenue Comparison: Cintas Corporation vs Allegion plc
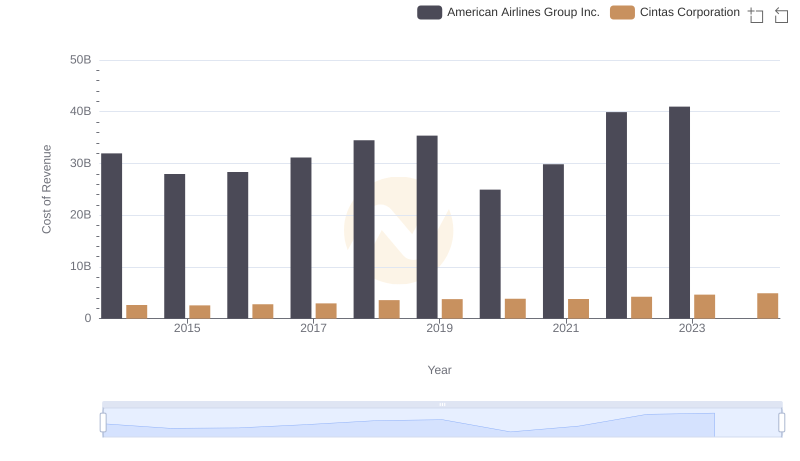
Comparing Cost of Revenue Efficiency: Cintas Corporation vs American Airlines Group Inc.
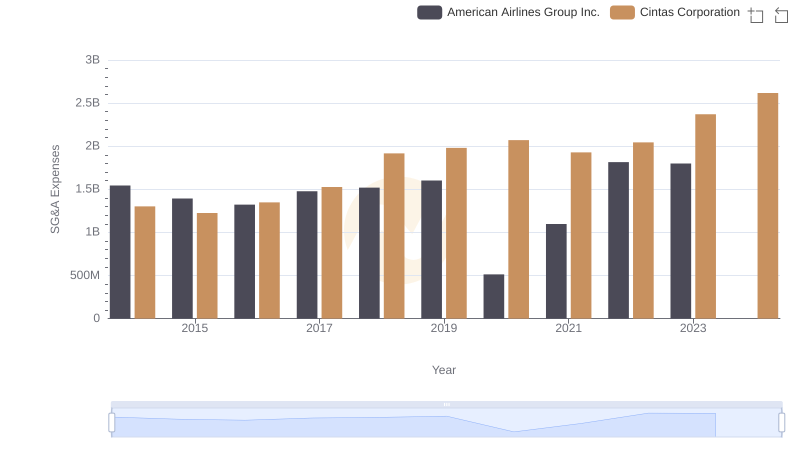
Cintas Corporation or American Airlines Group Inc.: Who Manages SG&A Costs Better?