| __timestamp | Cintas Corporation | ITT Inc. |
|---|---|---|
| Wednesday, January 1, 2014 | 2637426000 | 1788200000 |
| Thursday, January 1, 2015 | 2555549000 | 1676500000 |
| Friday, January 1, 2016 | 2775588000 | 1647200000 |
| Sunday, January 1, 2017 | 2943086000 | 1768100000 |
| Monday, January 1, 2018 | 3568109000 | 1857900000 |
| Tuesday, January 1, 2019 | 3763715000 | 1936300000 |
| Wednesday, January 1, 2020 | 3851372000 | 1695600000 |
| Friday, January 1, 2021 | 3801689000 | 1865500000 |
| Saturday, January 1, 2022 | 4222213000 | 2065400000 |
| Sunday, January 1, 2023 | 4642401000 | 2175700000 |
| Monday, January 1, 2024 | 4910199000 | 2383400000 |
Data in motion
In the ever-evolving landscape of corporate finance, understanding cost structures is pivotal. Cintas Corporation and ITT Inc., two giants in their respective industries, offer a fascinating study in cost management over the past decade. From 2014 to 2023, Cintas Corporation's cost of revenue surged by approximately 86%, reflecting its strategic expansions and operational scaling. In contrast, ITT Inc. experienced a more modest increase of around 22% in the same period, indicating a steady yet controlled growth approach.
The year 2023 marked a significant milestone for both companies, with Cintas reaching its highest cost of revenue, while ITT Inc. also saw a peak, albeit with a more conservative rise. Notably, data for 2024 is incomplete, highlighting the dynamic nature of financial forecasting. This comparative analysis underscores the diverse strategies employed by these corporations in navigating economic challenges and opportunities.
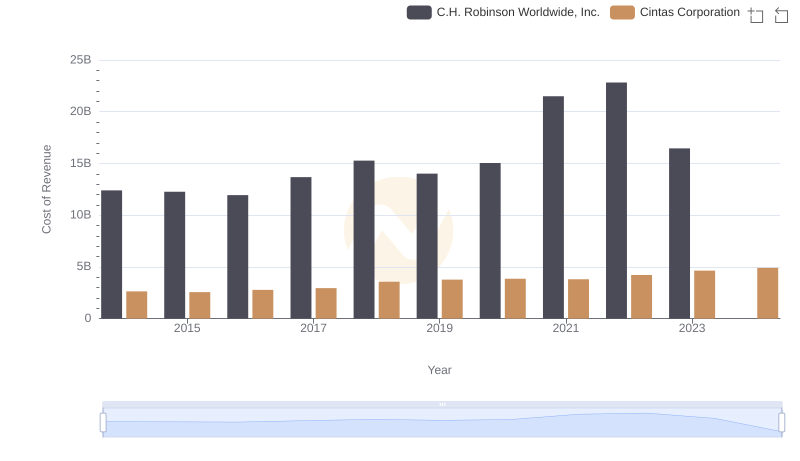
Cost of Revenue Trends: Cintas Corporation vs C.H. Robinson Worldwide, Inc.
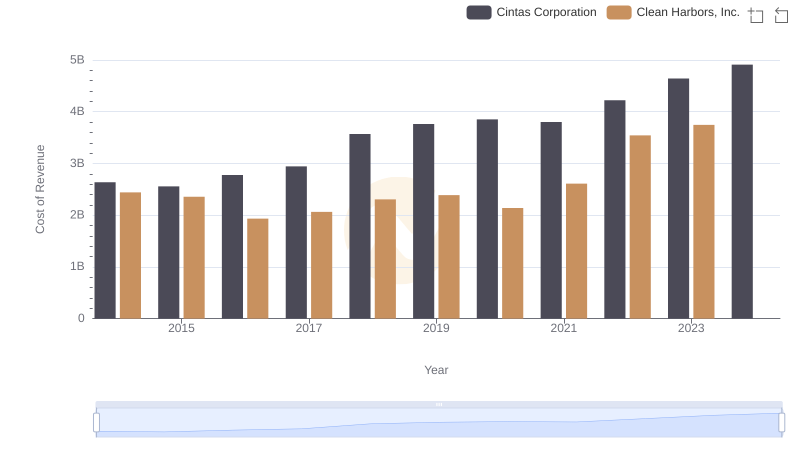
Analyzing Cost of Revenue: Cintas Corporation and Clean Harbors, Inc.
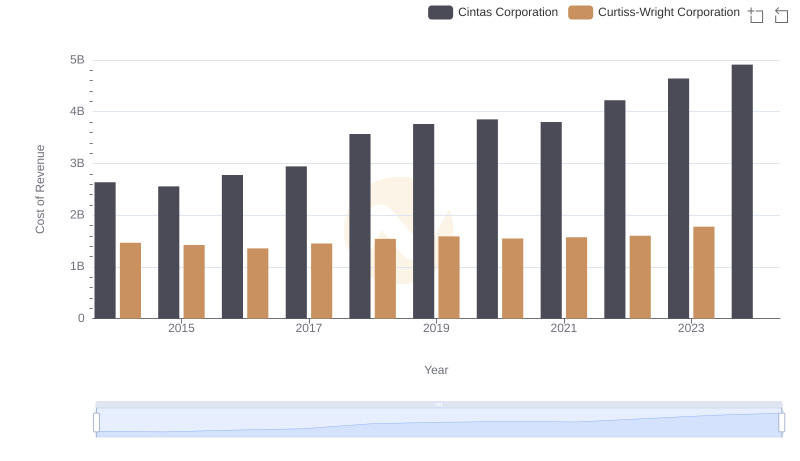
Cost of Revenue Comparison: Cintas Corporation vs Curtiss-Wright Corporation
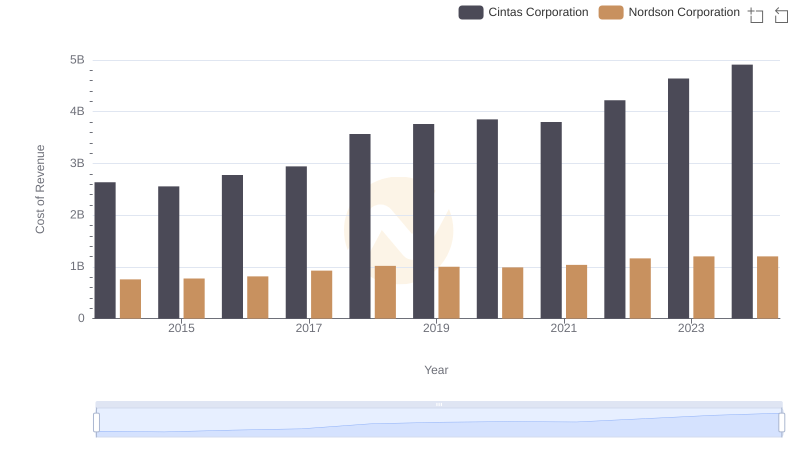
Comparing Cost of Revenue Efficiency: Cintas Corporation vs Nordson Corporation
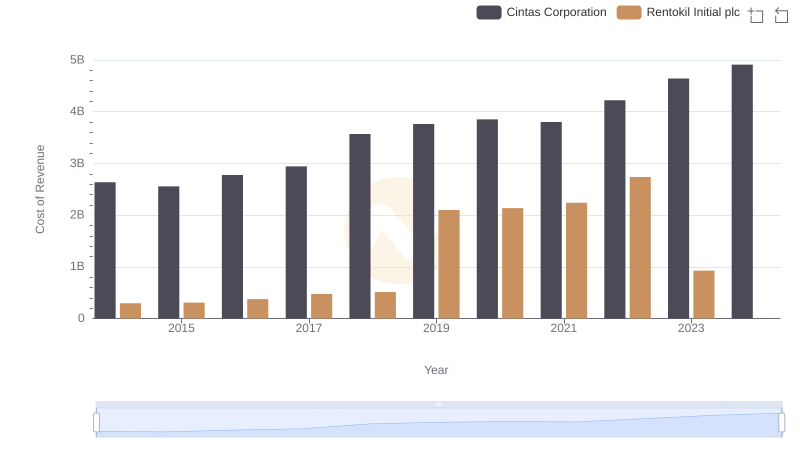
Cintas Corporation vs Rentokil Initial plc: Efficiency in Cost of Revenue Explored
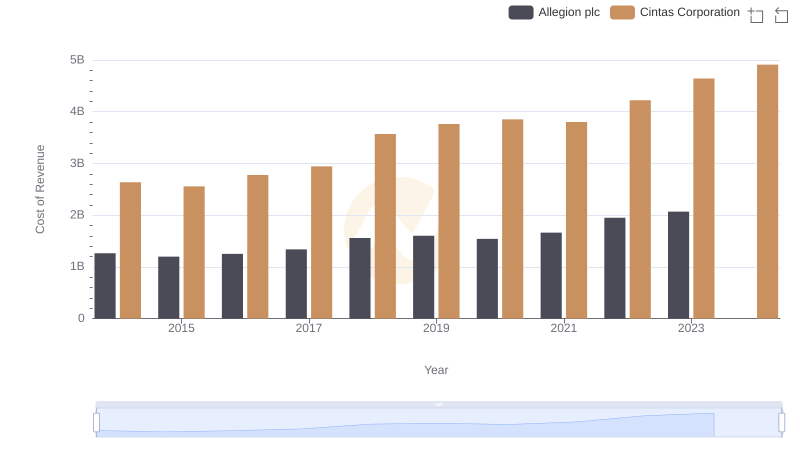
Analyzing Cost of Revenue: Cintas Corporation and Allegion plc
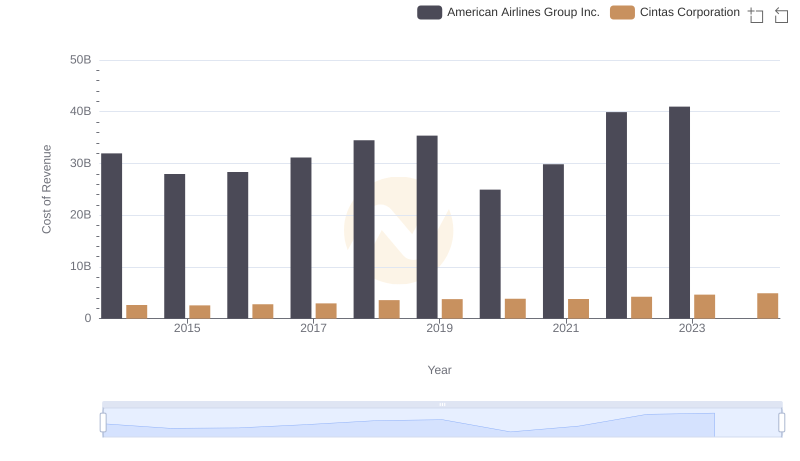
Comparing Cost of Revenue Efficiency: Cintas Corporation vs American Airlines Group Inc.
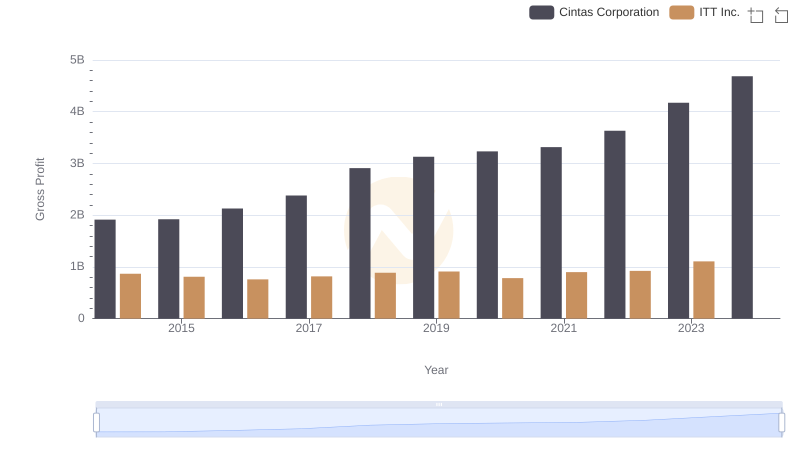
Cintas Corporation and ITT Inc.: A Detailed Gross Profit Analysis
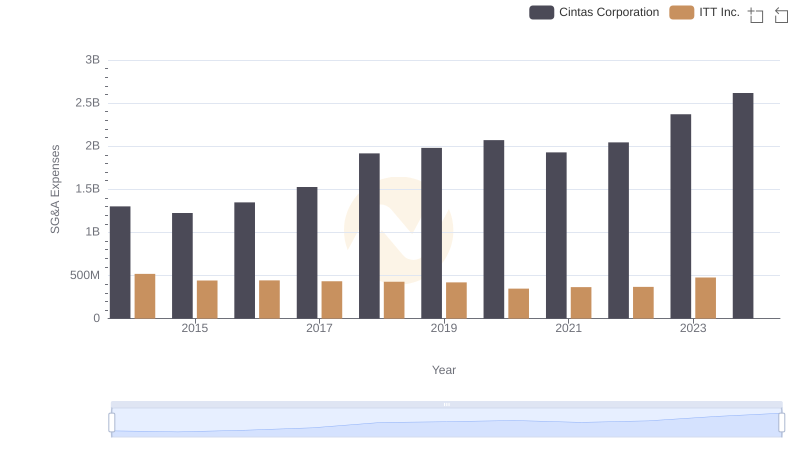
Operational Costs Compared: SG&A Analysis of Cintas Corporation and ITT Inc.