| __timestamp | Allegion plc | Cintas Corporation |
|---|---|---|
| Wednesday, January 1, 2014 | 1264600000 | 2637426000 |
| Thursday, January 1, 2015 | 1199000000 | 2555549000 |
| Friday, January 1, 2016 | 1252700000 | 2775588000 |
| Sunday, January 1, 2017 | 1337500000 | 2943086000 |
| Monday, January 1, 2018 | 1558400000 | 3568109000 |
| Tuesday, January 1, 2019 | 1601700000 | 3763715000 |
| Wednesday, January 1, 2020 | 1541100000 | 3851372000 |
| Friday, January 1, 2021 | 1662500000 | 3801689000 |
| Saturday, January 1, 2022 | 1949500000 | 4222213000 |
| Sunday, January 1, 2023 | 2069300000 | 4642401000 |
| Monday, January 1, 2024 | 2103700000 | 4910199000 |
Infusing magic into the data realm
In the competitive landscape of corporate America, understanding the cost of revenue is crucial for evaluating a company's efficiency and profitability. This analysis focuses on two industry leaders: Cintas Corporation and Allegion plc, from 2014 to 2023.
Cintas Corporation, a leader in corporate identity uniforms, has seen its cost of revenue grow by approximately 76% over the past decade, reflecting its expanding operations and market reach. In contrast, Allegion plc, a global provider of security products, experienced a 72% increase in its cost of revenue, indicating its strategic investments in innovation and market expansion.
Interestingly, while Cintas consistently outpaces Allegion in terms of absolute cost, both companies show a similar growth trajectory, highlighting their parallel strategies in scaling operations. The data for 2024 is incomplete, suggesting a need for further analysis to understand future trends.
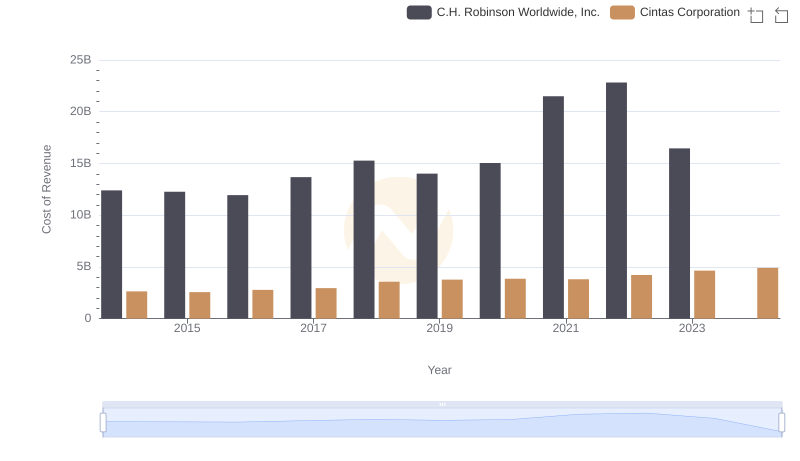
Cost of Revenue Trends: Cintas Corporation vs C.H. Robinson Worldwide, Inc.
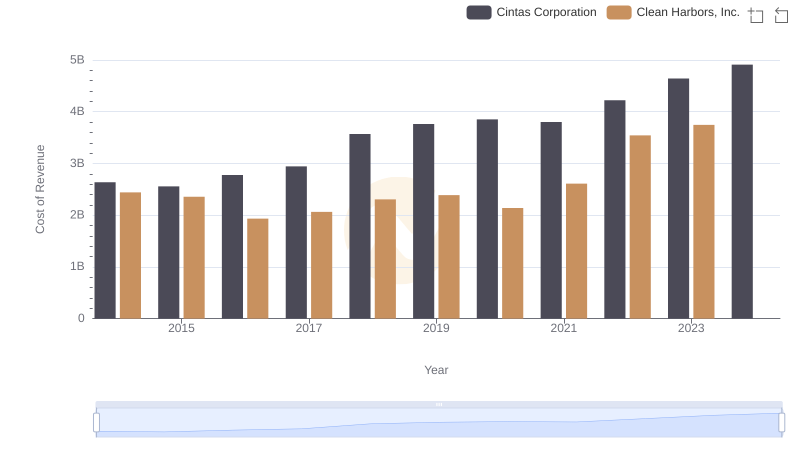
Analyzing Cost of Revenue: Cintas Corporation and Clean Harbors, Inc.
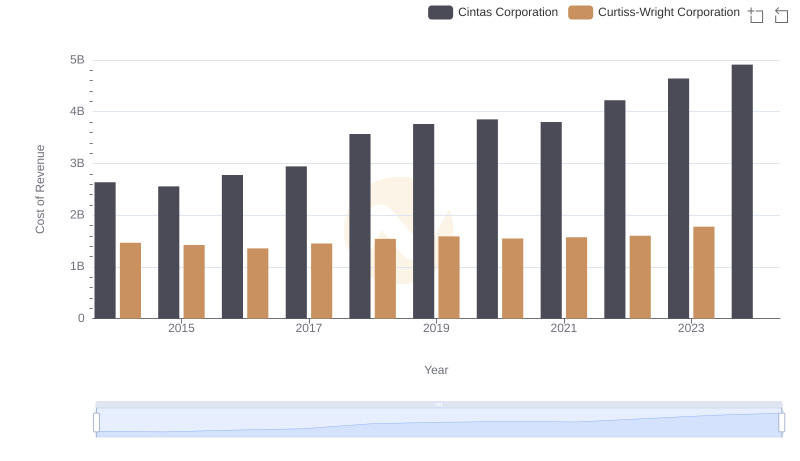
Cost of Revenue Comparison: Cintas Corporation vs Curtiss-Wright Corporation
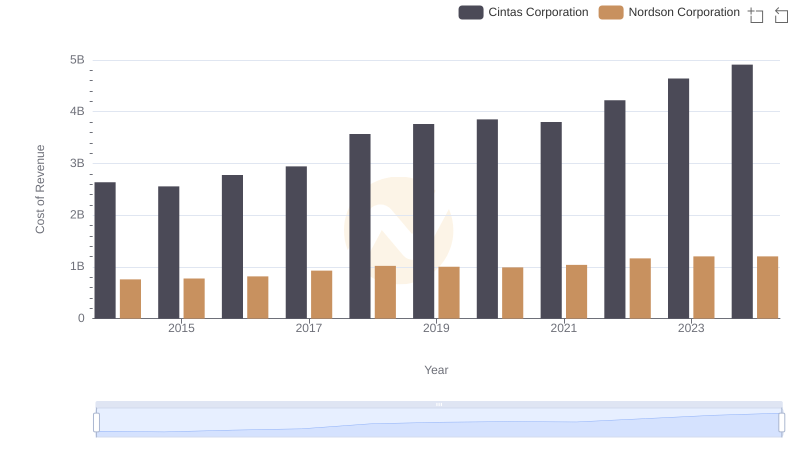
Comparing Cost of Revenue Efficiency: Cintas Corporation vs Nordson Corporation
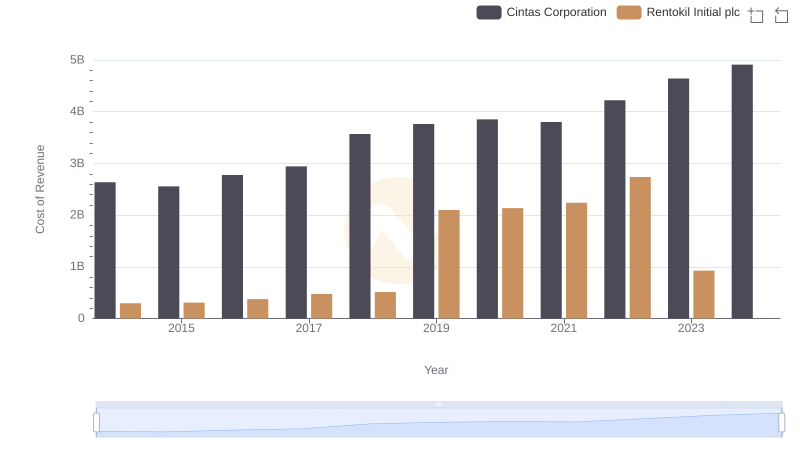
Cintas Corporation vs Rentokil Initial plc: Efficiency in Cost of Revenue Explored
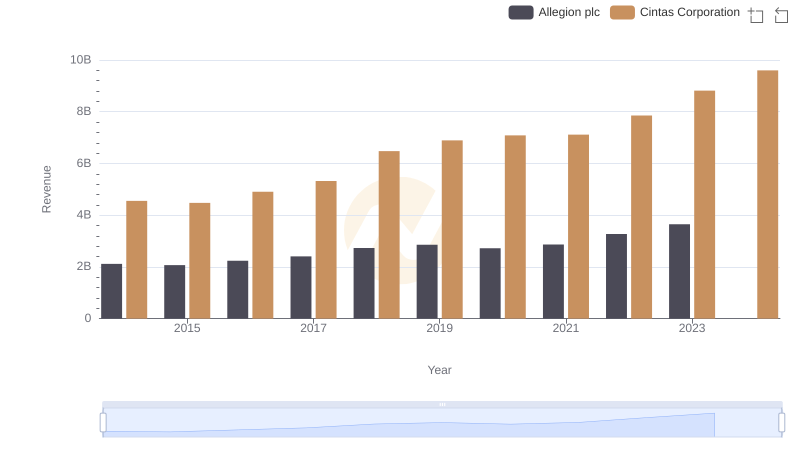
Annual Revenue Comparison: Cintas Corporation vs Allegion plc
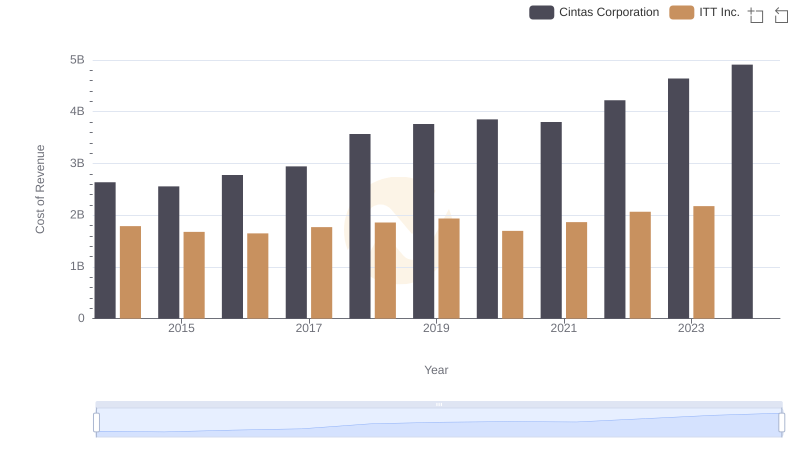
Cost Insights: Breaking Down Cintas Corporation and ITT Inc.'s Expenses
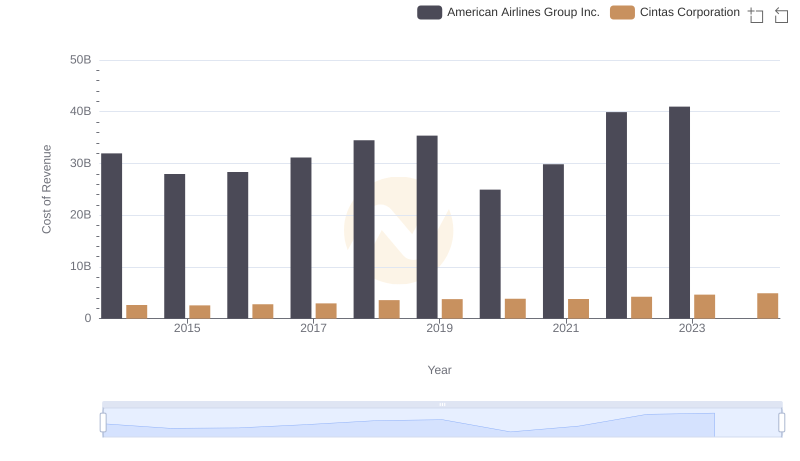
Comparing Cost of Revenue Efficiency: Cintas Corporation vs American Airlines Group Inc.
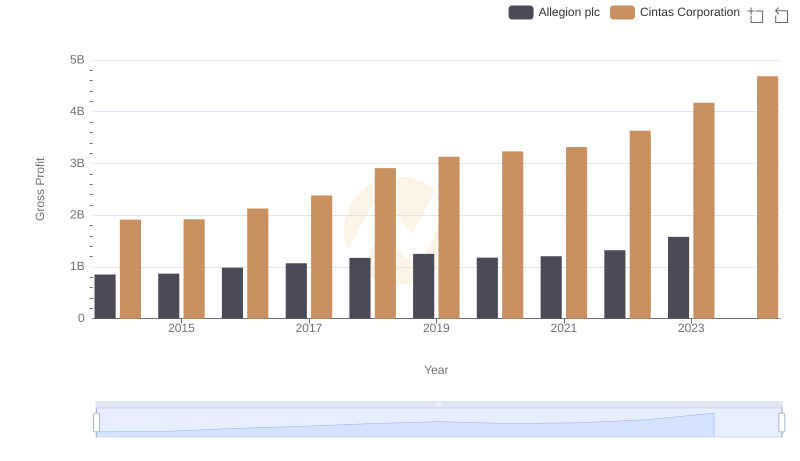
Gross Profit Trends Compared: Cintas Corporation vs Allegion plc