| __timestamp | CNH Industrial N.V. | United Rentals, Inc. |
|---|---|---|
| Wednesday, January 1, 2014 | 2591000000 | 1678000000 |
| Thursday, January 1, 2015 | 1757000000 | 2653000000 |
| Friday, January 1, 2016 | 1063000000 | 2566000000 |
| Sunday, January 1, 2017 | 1715000000 | 2843000000 |
| Monday, January 1, 2018 | 2339000000 | 3628000000 |
| Tuesday, January 1, 2019 | 2077000000 | 4200000000 |
| Wednesday, January 1, 2020 | 807000000 | 2195000000 |
| Friday, January 1, 2021 | 2650000000 | 2642000000 |
| Saturday, January 1, 2022 | 3447000000 | 5464000000 |
| Sunday, January 1, 2023 | 5549000000 | 6627000000 |
| Monday, January 1, 2024 | 4516000000 |
Unleashing insights
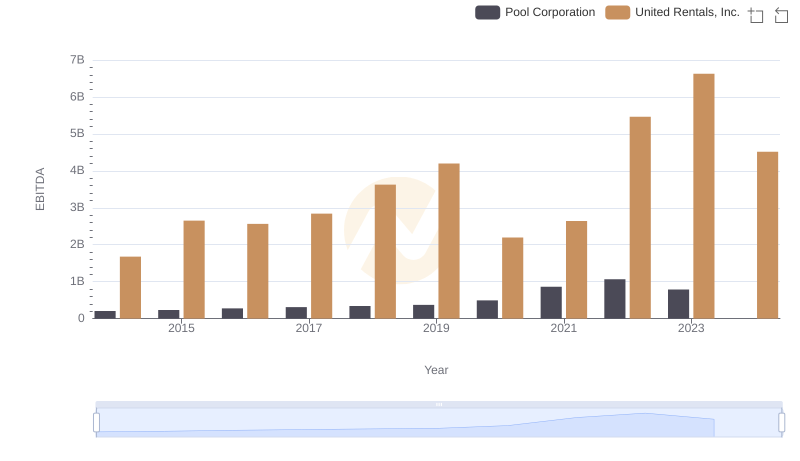
In the ever-evolving landscape of industrial equipment, United Rentals, Inc. and CNH Industrial N.V. have been pivotal players. Over the past decade, United Rentals has consistently outperformed CNH Industrial in terms of EBITDA, showcasing a robust growth trajectory. From 2014 to 2023, United Rentals' EBITDA surged by approximately 295%, peaking in 2023. In contrast, CNH Industrial experienced a more modest growth of around 114% over the same period.
The year 2023 marked a significant milestone, with United Rentals achieving an EBITDA of 6.63 billion, a 21% increase from the previous year. Meanwhile, CNH Industrial reached 5.55 billion, reflecting a remarkable 61% growth from 2022. This data highlights United Rentals' strategic prowess in capitalizing on market opportunities, while CNH Industrial's recent surge suggests a promising upward trend. However, the absence of 2024 data for CNH Industrial leaves room for speculation on its future performance.
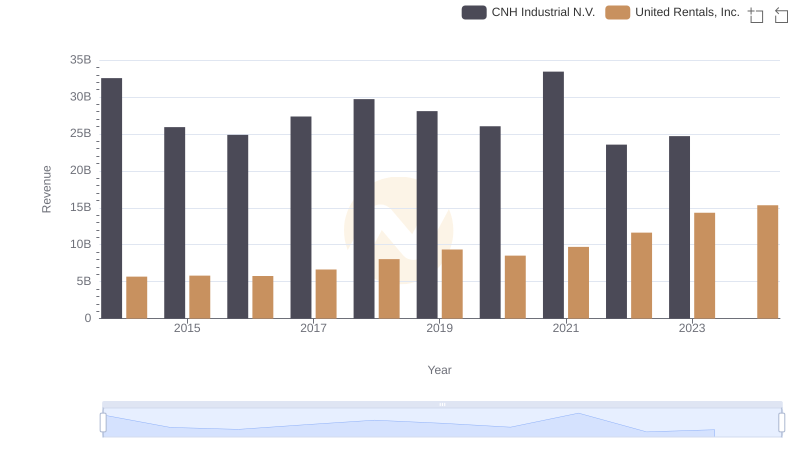
United Rentals, Inc. or CNH Industrial N.V.: Who Leads in Yearly Revenue?
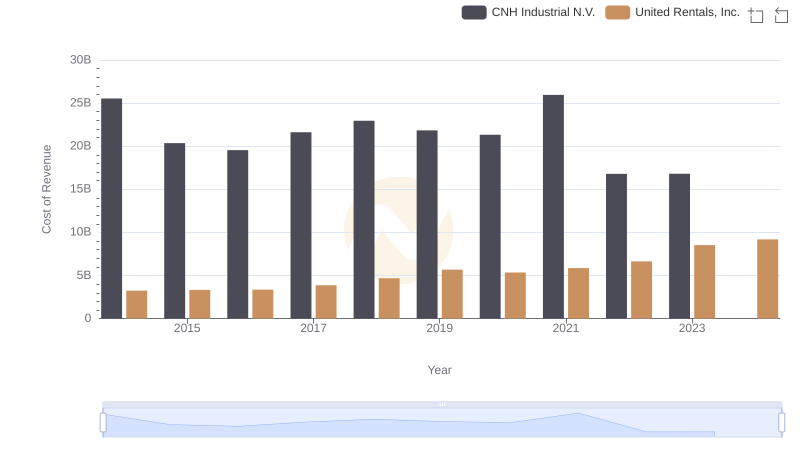
Comparing Cost of Revenue Efficiency: United Rentals, Inc. vs CNH Industrial N.V.
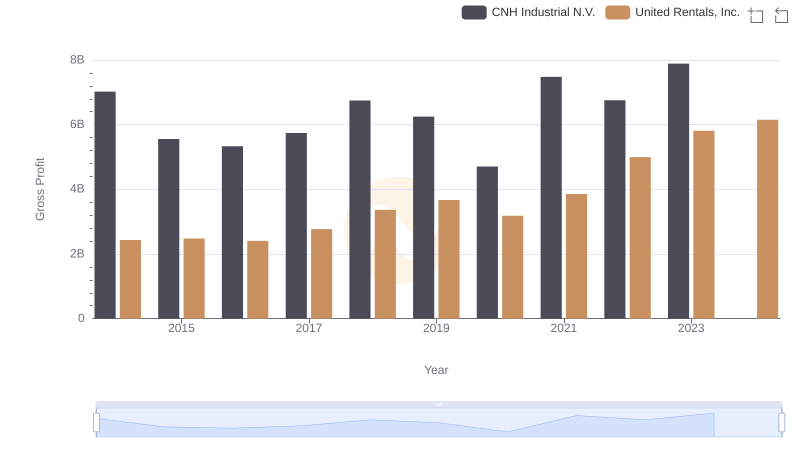
Gross Profit Analysis: Comparing United Rentals, Inc. and CNH Industrial N.V.
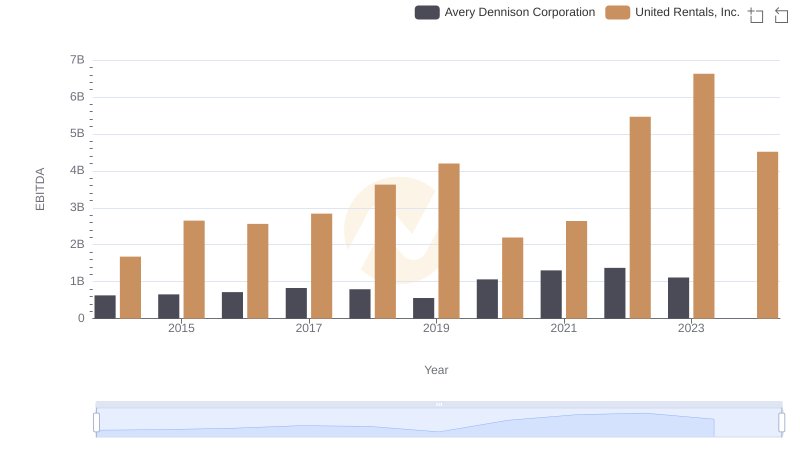
Comparative EBITDA Analysis: United Rentals, Inc. vs Avery Dennison Corporation
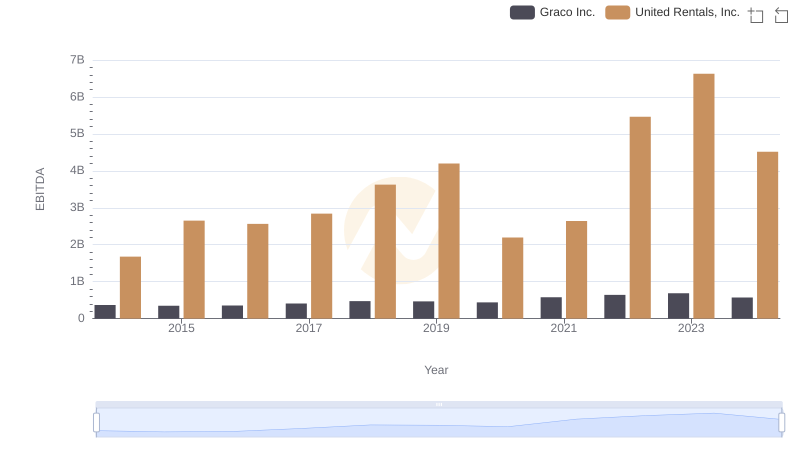
EBITDA Analysis: Evaluating United Rentals, Inc. Against Graco Inc.
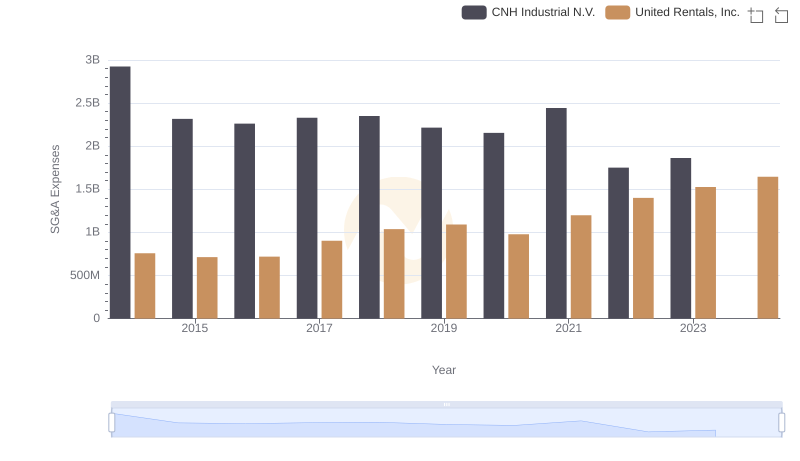
United Rentals, Inc. vs CNH Industrial N.V.: SG&A Expense Trends
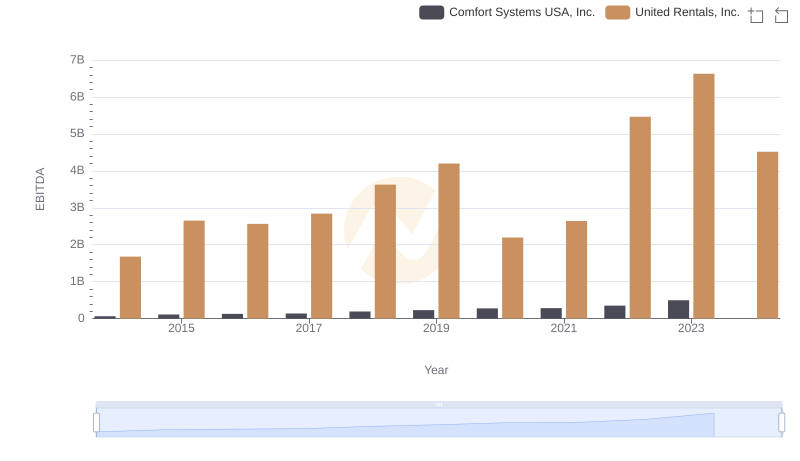
A Side-by-Side Analysis of EBITDA: United Rentals, Inc. and Comfort Systems USA, Inc.
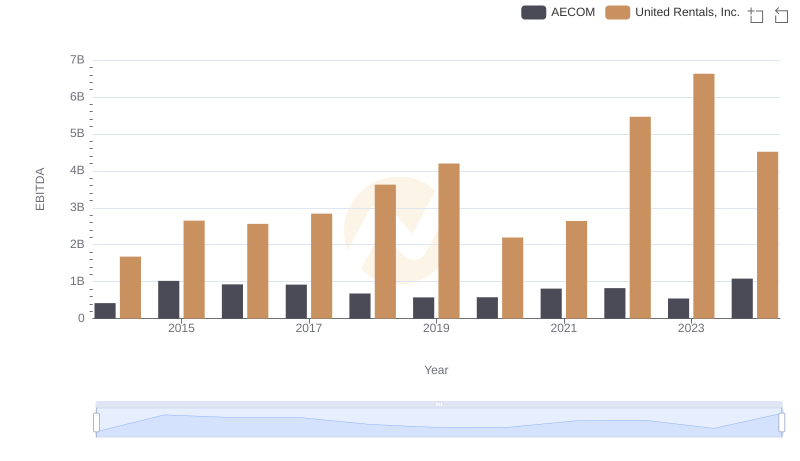
A Professional Review of EBITDA: United Rentals, Inc. Compared to AECOM
Comparative EBITDA Analysis: United Rentals, Inc. vs Pool Corporation

Comprehensive EBITDA Comparison: United Rentals, Inc. vs Stanley Black & Decker, Inc.