| __timestamp | AECOM | United Rentals, Inc. |
|---|---|---|
| Wednesday, January 1, 2014 | 417662000 | 1678000000 |
| Thursday, January 1, 2015 | 1020478000 | 2653000000 |
| Friday, January 1, 2016 | 926466000 | 2566000000 |
| Sunday, January 1, 2017 | 920292000 | 2843000000 |
| Monday, January 1, 2018 | 680801000 | 3628000000 |
| Tuesday, January 1, 2019 | 573352000 | 4200000000 |
| Wednesday, January 1, 2020 | 580017000 | 2195000000 |
| Friday, January 1, 2021 | 813356000 | 2642000000 |
| Saturday, January 1, 2022 | 826856000 | 5464000000 |
| Sunday, January 1, 2023 | 543642000 | 6627000000 |
| Monday, January 1, 2024 | 1082384000 | 4516000000 |
Unlocking the unknown
In the world of construction and equipment rental, EBITDA serves as a crucial indicator of financial health. Over the past decade, United Rentals, Inc. has consistently outperformed AECOM, showcasing a robust growth trajectory. From 2014 to 2023, United Rentals' EBITDA surged by nearly 295%, peaking in 2023 with a remarkable $6.63 billion. In contrast, AECOM's EBITDA displayed a more modest growth, with a 30% increase over the same period, reaching its highest point in 2024 at $1.08 billion.
This comparison highlights United Rentals' strategic prowess in capitalizing on market opportunities, while AECOM's steady performance underscores its resilience in a competitive landscape. As we look to the future, these trends offer valuable insights into the evolving dynamics of the construction and equipment rental sectors.
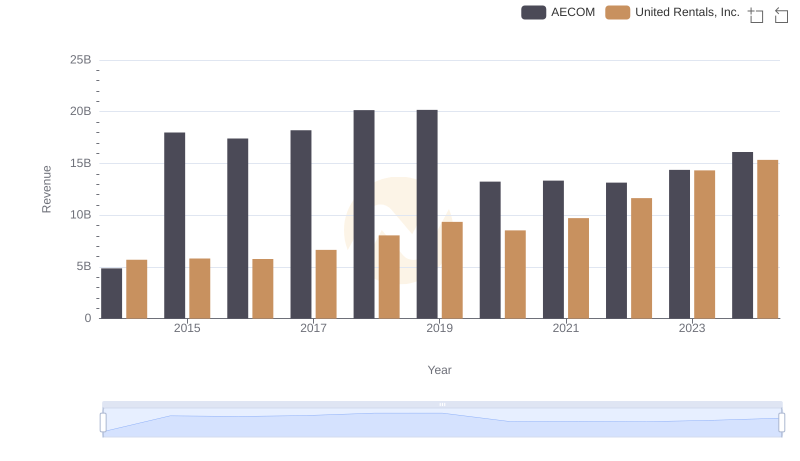
United Rentals, Inc. or AECOM: Who Leads in Yearly Revenue?
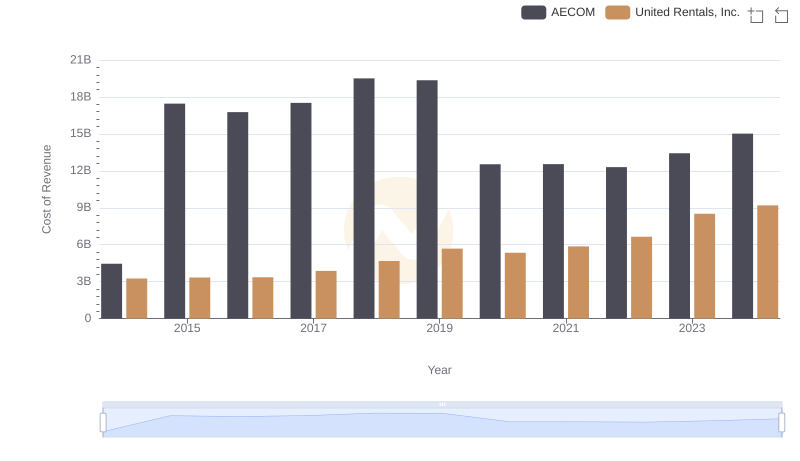
Cost of Revenue Comparison: United Rentals, Inc. vs AECOM
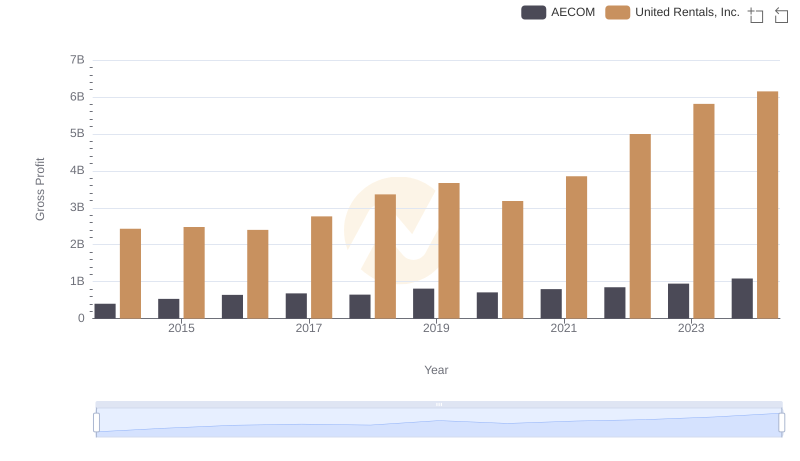
United Rentals, Inc. and AECOM: A Detailed Gross Profit Analysis
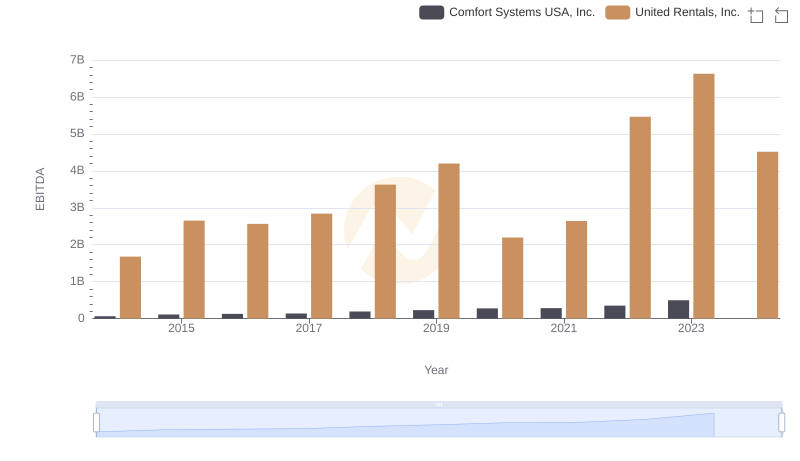
A Side-by-Side Analysis of EBITDA: United Rentals, Inc. and Comfort Systems USA, Inc.
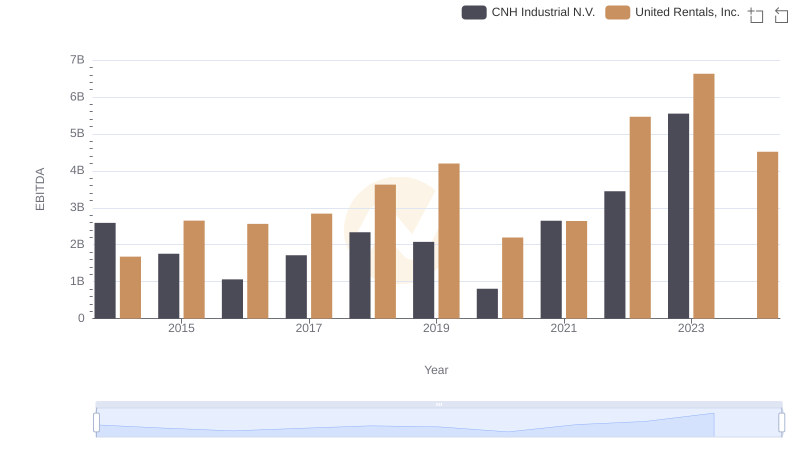
Comprehensive EBITDA Comparison: United Rentals, Inc. vs CNH Industrial N.V.
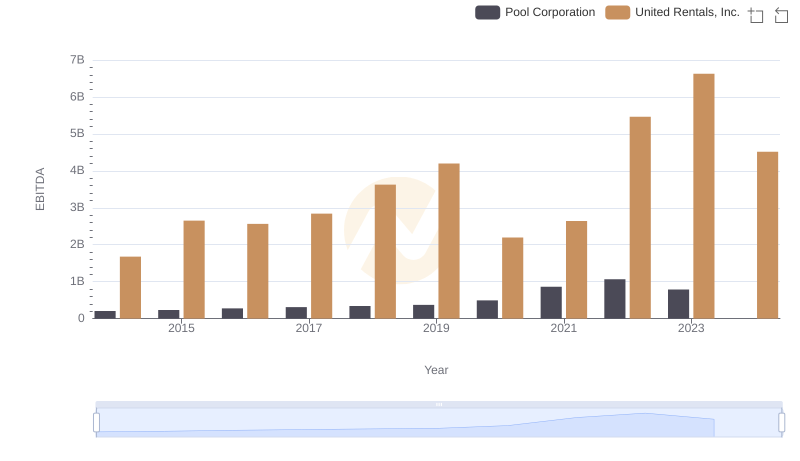
Comparative EBITDA Analysis: United Rentals, Inc. vs Pool Corporation

Comprehensive EBITDA Comparison: United Rentals, Inc. vs Stanley Black & Decker, Inc.
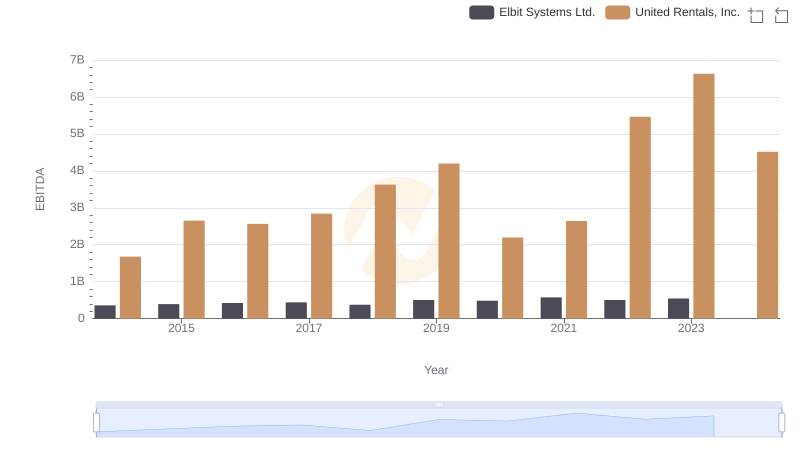
A Side-by-Side Analysis of EBITDA: United Rentals, Inc. and Elbit Systems Ltd.
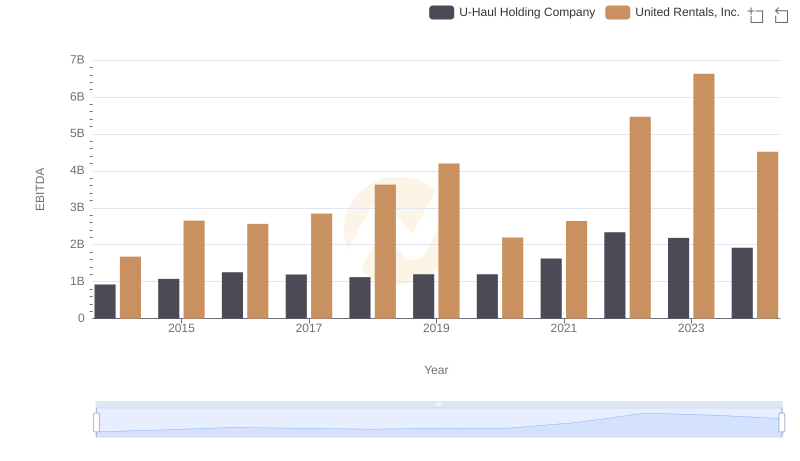
EBITDA Metrics Evaluated: United Rentals, Inc. vs U-Haul Holding Company