| __timestamp | Cognizant Technology Solutions Corporation | Intuit Inc. |
|---|---|---|
| Wednesday, January 1, 2014 | 4121563000 | 3838000000 |
| Thursday, January 1, 2015 | 4975800000 | 3467000000 |
| Friday, January 1, 2016 | 5379000000 | 3942000000 |
| Sunday, January 1, 2017 | 5658000000 | 4368000000 |
| Monday, January 1, 2018 | 6287000000 | 4987000000 |
| Tuesday, January 1, 2019 | 6149000000 | 5617000000 |
| Wednesday, January 1, 2020 | 5981000000 | 6301000000 |
| Friday, January 1, 2021 | 6903000000 | 7950000000 |
| Saturday, January 1, 2022 | 6980000000 | 10320000000 |
| Sunday, January 1, 2023 | 6689000000 | 11225000000 |
| Monday, January 1, 2024 | 6778000000 | 12820000000 |
Unveiling the hidden dimensions of data
In the ever-evolving landscape of technology giants, the financial performance of Intuit Inc. and Cognizant Technology Solutions Corporation offers a fascinating glimpse into their strategic prowess. Over the past decade, Intuit has demonstrated a remarkable growth trajectory, with its gross profit soaring by approximately 234% from 2014 to 2023. This impressive rise underscores Intuit's ability to innovate and capture market share, particularly in the financial software sector.
Conversely, Cognizant Technology Solutions has shown steady growth, with a 62% increase in gross profit over the same period. While Cognizant's growth is commendable, it highlights a more conservative expansion strategy compared to Intuit's aggressive approach. Notably, the data for 2024 is incomplete, leaving room for speculation on future trends. As these two titans continue to compete, their financial narratives provide valuable insights into the broader tech industry's dynamics.
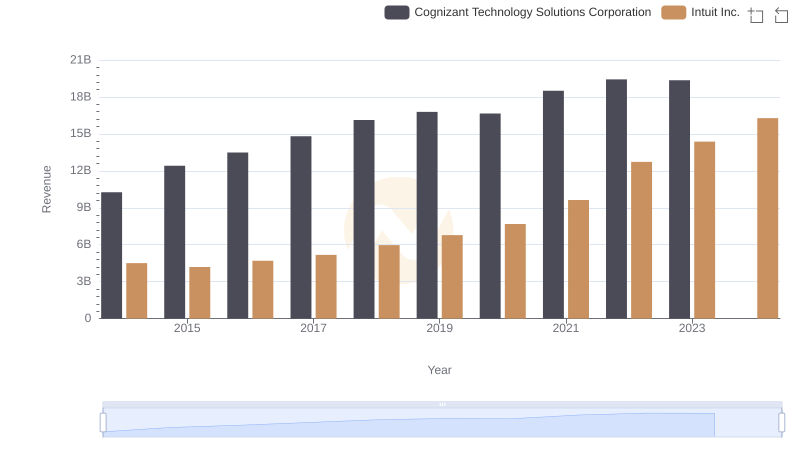
Revenue Insights: Intuit Inc. and Cognizant Technology Solutions Corporation Performance Compared
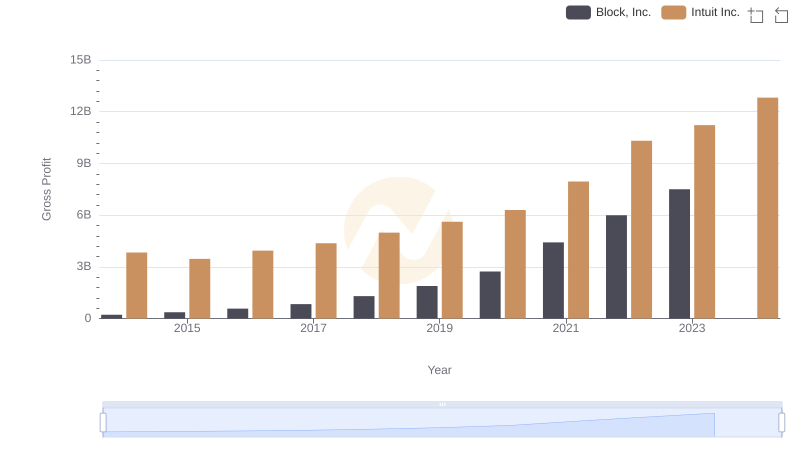
Gross Profit Comparison: Intuit Inc. and Block, Inc. Trends
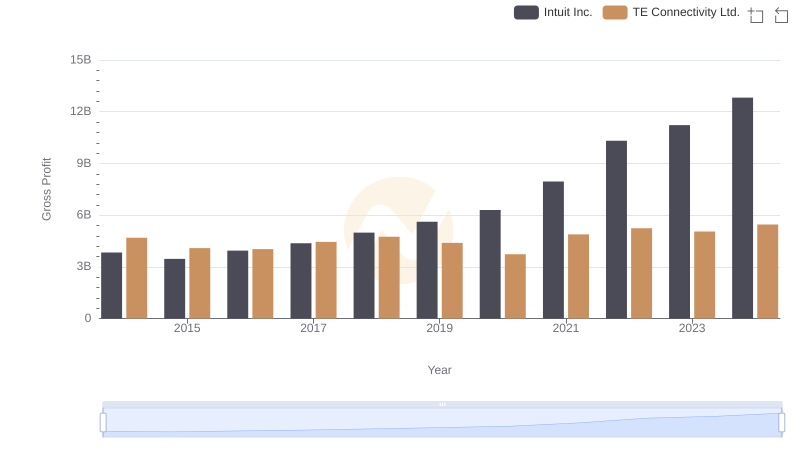
Intuit Inc. vs TE Connectivity Ltd.: A Gross Profit Performance Breakdown
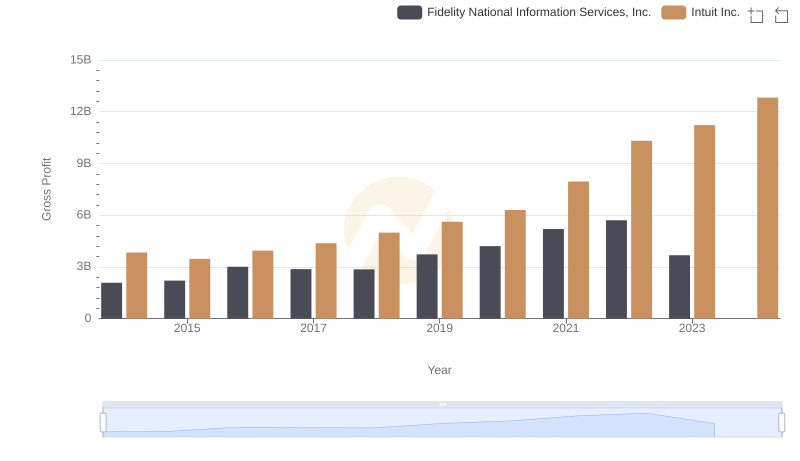
Gross Profit Analysis: Comparing Intuit Inc. and Fidelity National Information Services, Inc.
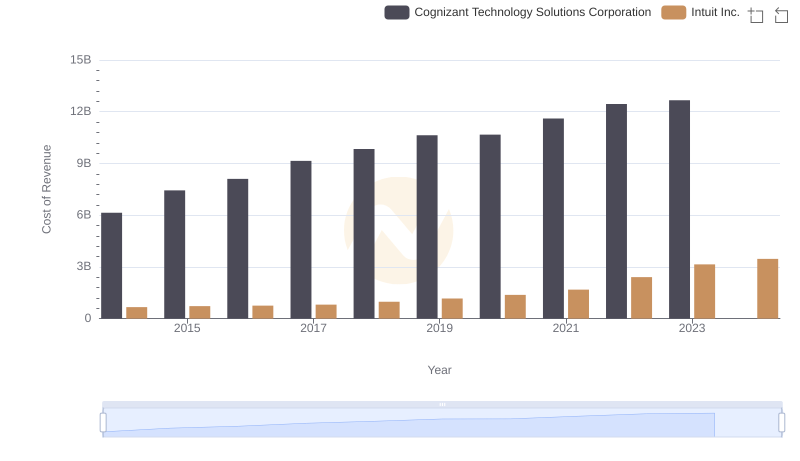
Cost Insights: Breaking Down Intuit Inc. and Cognizant Technology Solutions Corporation's Expenses
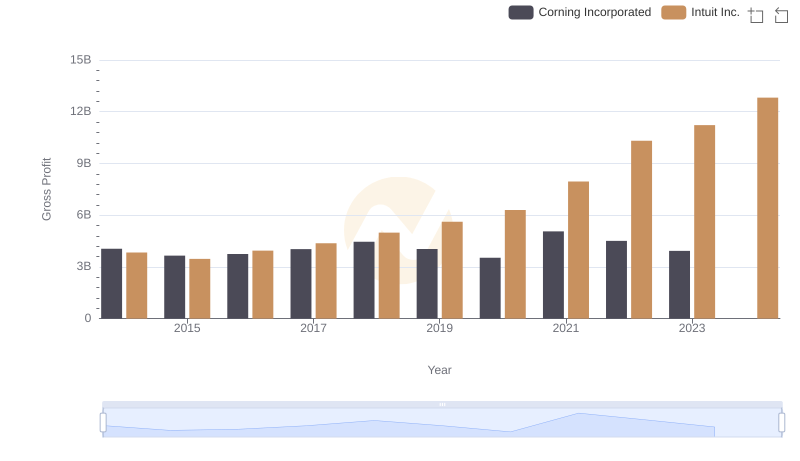
Gross Profit Trends Compared: Intuit Inc. vs Corning Incorporated
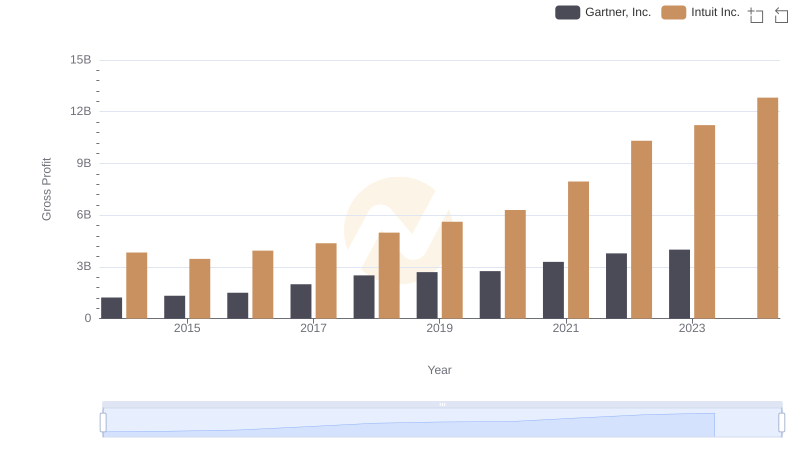
Who Generates Higher Gross Profit? Intuit Inc. or Gartner, Inc.
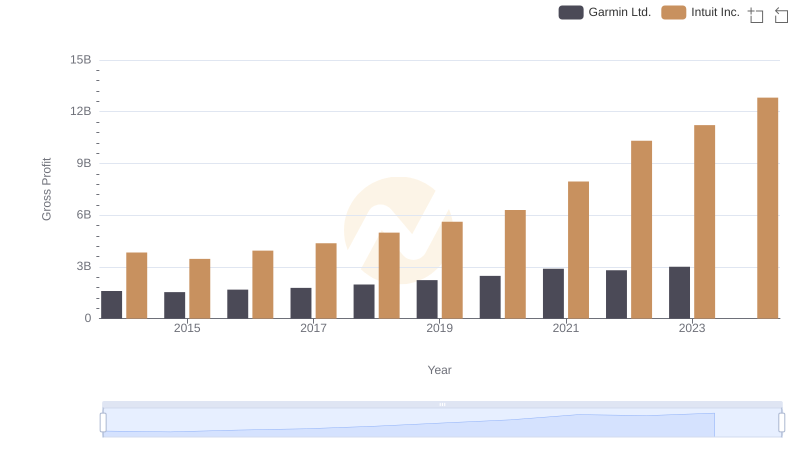
Intuit Inc. vs Garmin Ltd.: A Gross Profit Performance Breakdown
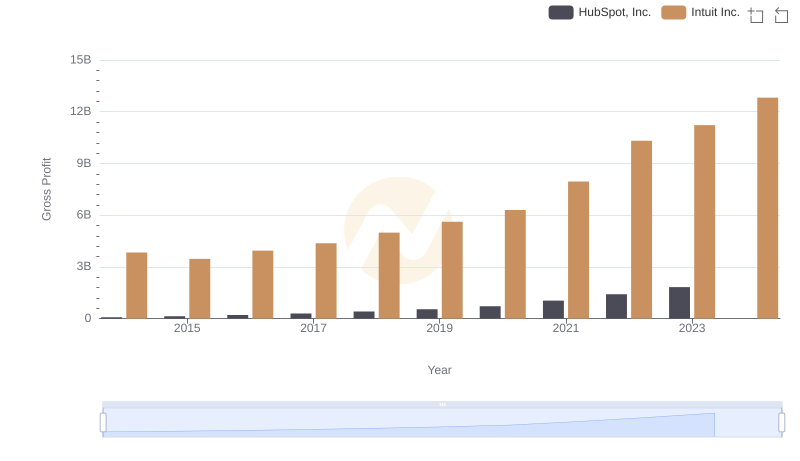
Gross Profit Analysis: Comparing Intuit Inc. and HubSpot, Inc.
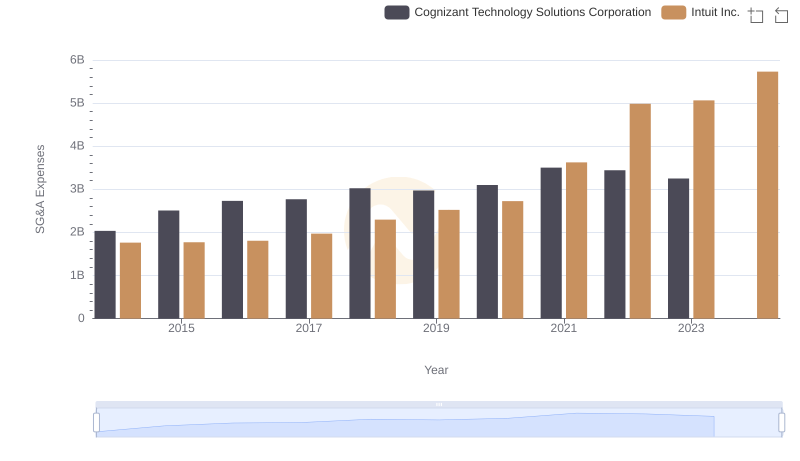
Cost Management Insights: SG&A Expenses for Intuit Inc. and Cognizant Technology Solutions Corporation
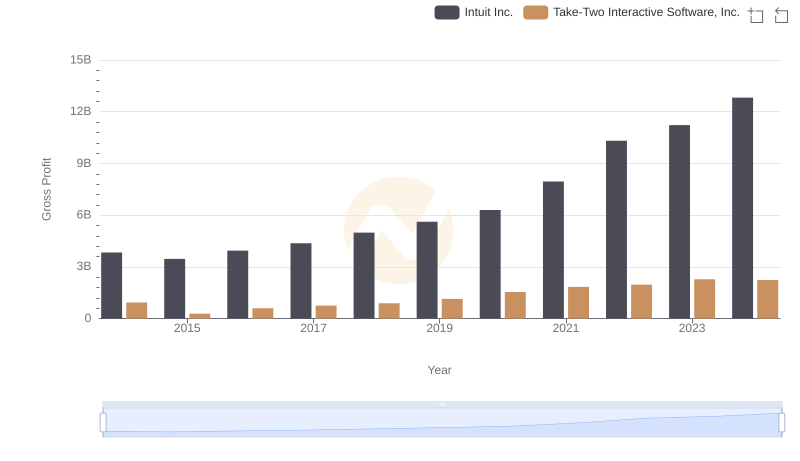
Intuit Inc. and Take-Two Interactive Software, Inc.: A Detailed Gross Profit Analysis
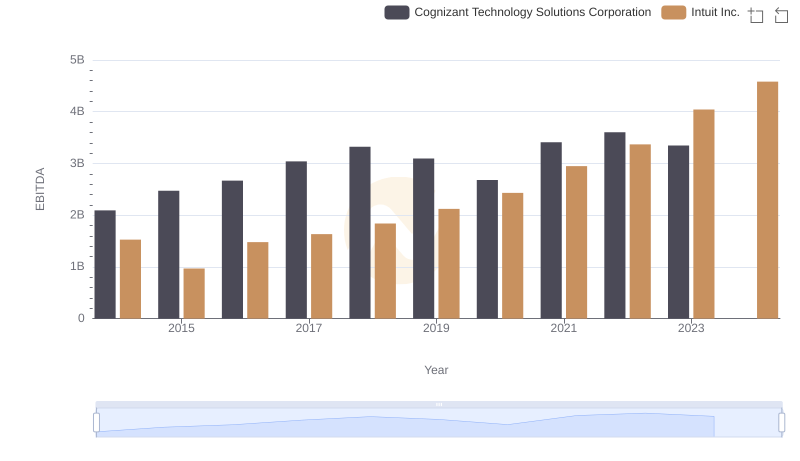
Comparative EBITDA Analysis: Intuit Inc. vs Cognizant Technology Solutions Corporation