| __timestamp | Cognizant Technology Solutions Corporation | Intuit Inc. |
|---|---|---|
| Wednesday, January 1, 2014 | 10262681000 | 4506000000 |
| Thursday, January 1, 2015 | 12416000000 | 4192000000 |
| Friday, January 1, 2016 | 13487000000 | 4694000000 |
| Sunday, January 1, 2017 | 14810000000 | 5177000000 |
| Monday, January 1, 2018 | 16125000000 | 5964000000 |
| Tuesday, January 1, 2019 | 16783000000 | 6784000000 |
| Wednesday, January 1, 2020 | 16652000000 | 7679000000 |
| Friday, January 1, 2021 | 18507000000 | 9633000000 |
| Saturday, January 1, 2022 | 19428000000 | 12726000000 |
| Sunday, January 1, 2023 | 19353000000 | 14368000000 |
| Monday, January 1, 2024 | 19736000000 | 16285000000 |
Unveiling the hidden dimensions of data
In the ever-evolving tech industry, revenue growth is a key indicator of a company's success. This analysis compares the annual revenue performance of Intuit Inc. and Cognizant Technology Solutions Corporation from 2014 to 2023. Over this period, Cognizant consistently outperformed Intuit in terms of revenue, with a peak in 2022 reaching approximately $19.4 billion. However, Intuit has shown remarkable growth, with its revenue more than tripling from 2014 to 2023, reaching around $14.4 billion.
This data provides a fascinating glimpse into the competitive dynamics of these two tech giants.
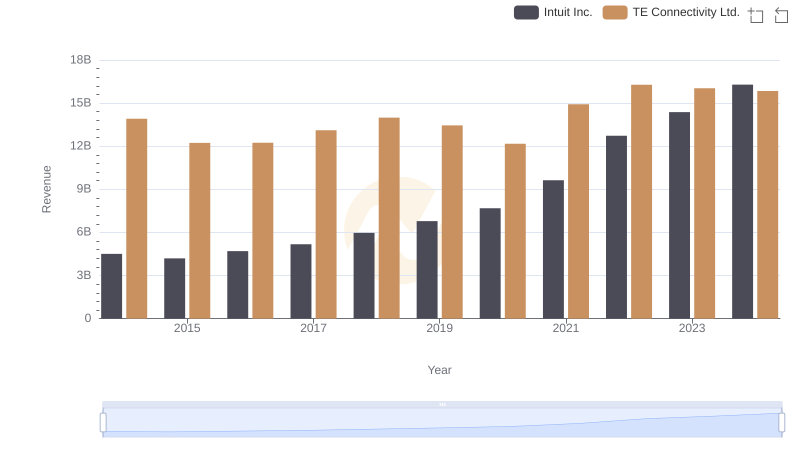
Annual Revenue Comparison: Intuit Inc. vs TE Connectivity Ltd.
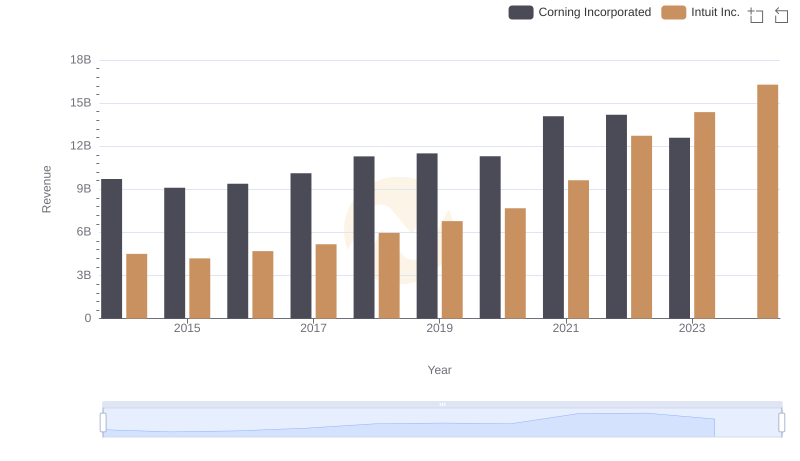
Intuit Inc. vs Corning Incorporated: Examining Key Revenue Metrics
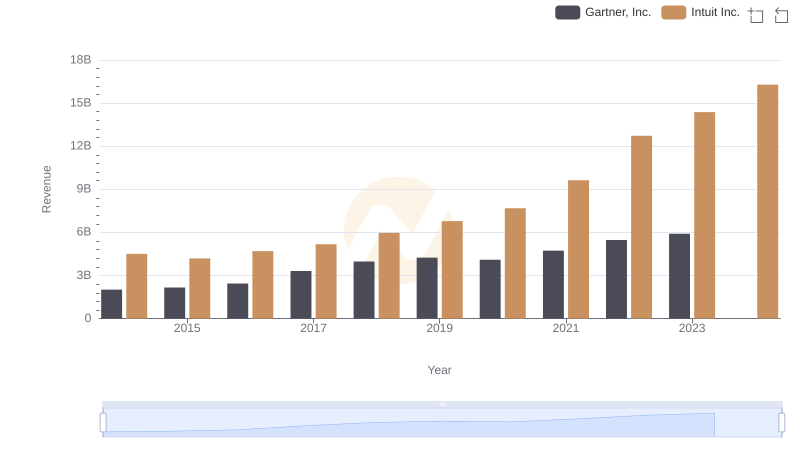
Intuit Inc. and Gartner, Inc.: A Comprehensive Revenue Analysis
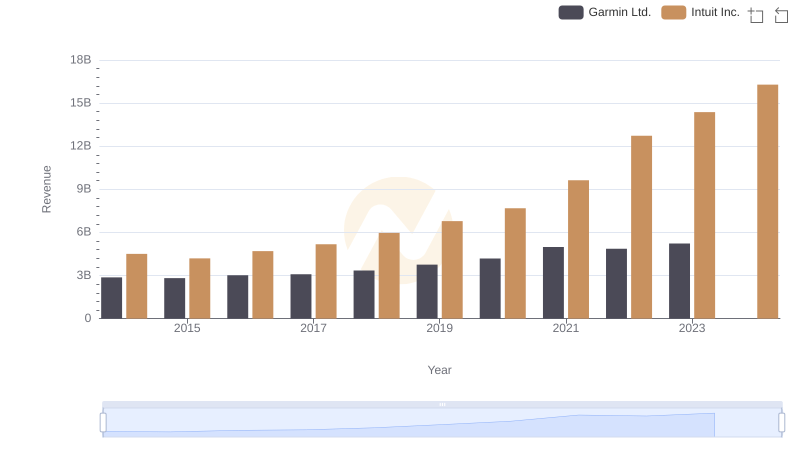
Revenue Showdown: Intuit Inc. vs Garmin Ltd.
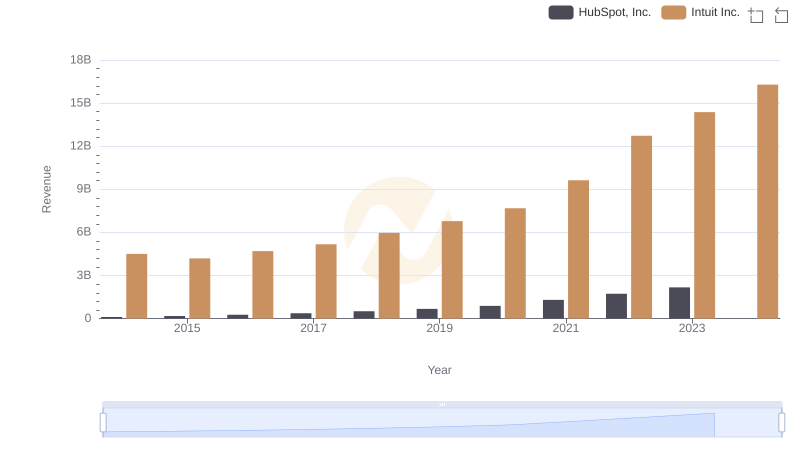
Comparing Revenue Performance: Intuit Inc. or HubSpot, Inc.?
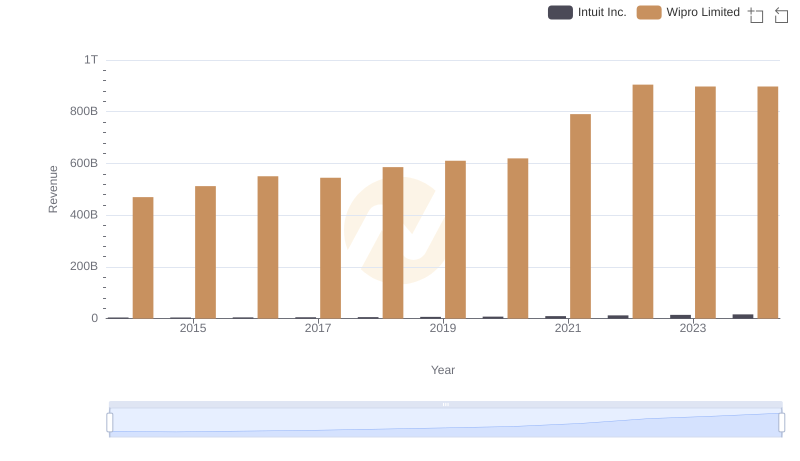
Intuit Inc. or Wipro Limited: Who Leads in Yearly Revenue?
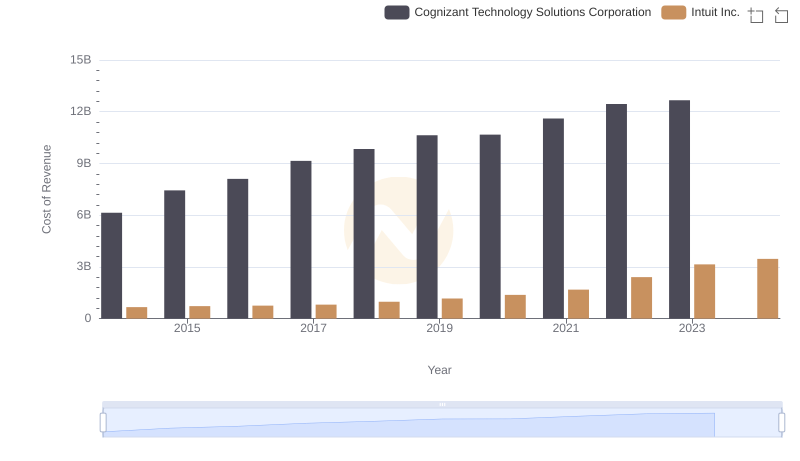
Cost Insights: Breaking Down Intuit Inc. and Cognizant Technology Solutions Corporation's Expenses
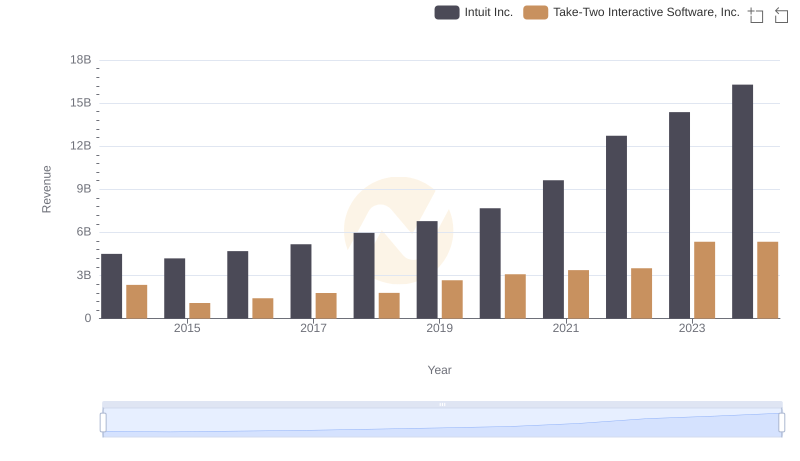
Intuit Inc. and Take-Two Interactive Software, Inc.: A Comprehensive Revenue Analysis
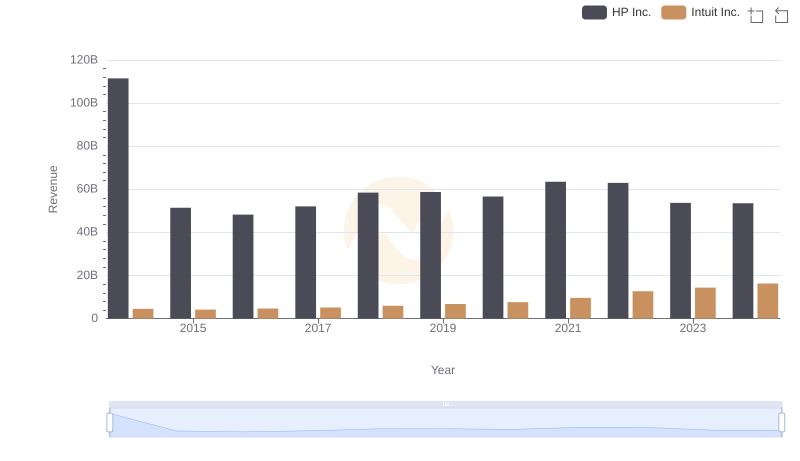
Intuit Inc. or HP Inc.: Who Leads in Yearly Revenue?
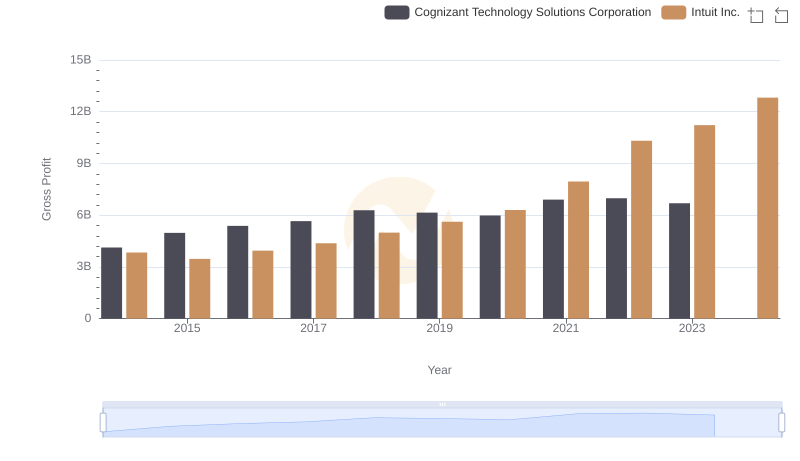
Gross Profit Analysis: Comparing Intuit Inc. and Cognizant Technology Solutions Corporation
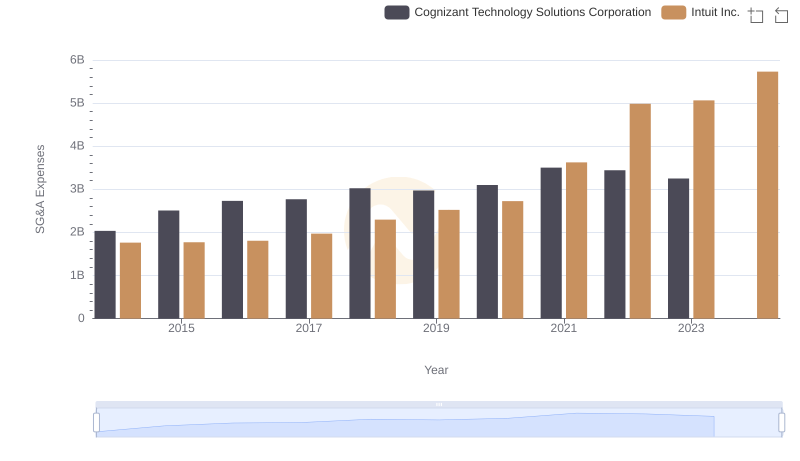
Cost Management Insights: SG&A Expenses for Intuit Inc. and Cognizant Technology Solutions Corporation
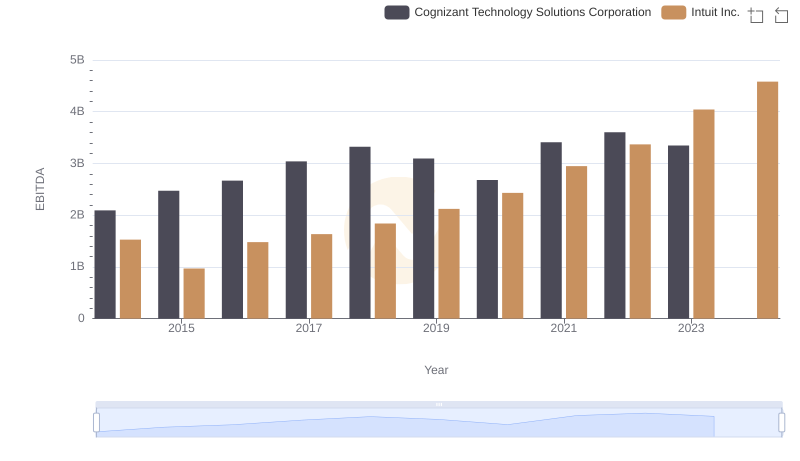
Comparative EBITDA Analysis: Intuit Inc. vs Cognizant Technology Solutions Corporation