| __timestamp | Intel Corporation | International Business Machines Corporation |
|---|---|---|
| Wednesday, January 1, 2014 | 20261000000 | 46386000000 |
| Thursday, January 1, 2015 | 20676000000 | 41057000000 |
| Friday, January 1, 2016 | 23196000000 | 41403000000 |
| Sunday, January 1, 2017 | 23692000000 | 42196000000 |
| Monday, January 1, 2018 | 27111000000 | 42655000000 |
| Tuesday, January 1, 2019 | 29825000000 | 26181000000 |
| Wednesday, January 1, 2020 | 34255000000 | 24314000000 |
| Friday, January 1, 2021 | 35209000000 | 25865000000 |
| Saturday, January 1, 2022 | 36188000000 | 27842000000 |
| Sunday, January 1, 2023 | 32517000000 | 27560000000 |
| Monday, January 1, 2024 | 35756000000 | 27202000000 |
Unlocking the unknown
In the ever-evolving tech industry, understanding cost structures is crucial for investors and analysts alike. This analysis delves into the cost of revenue for two giants: International Business Machines Corporation (IBM) and Intel Corporation, from 2014 to 2023. Over this period, IBM's cost of revenue has seen a significant decline of approximately 41%, from 46.4 billion in 2014 to 27.6 billion in 2023. Meanwhile, Intel's costs have surged by about 60%, peaking at 36.2 billion in 2022. This divergence highlights IBM's strategic shift towards efficiency, while Intel's rising costs may reflect its aggressive expansion and innovation strategies. Notably, 2024 data for Intel is missing, leaving room for speculation on future trends. As these tech titans navigate the competitive landscape, their cost management strategies will be pivotal in shaping their market positions.
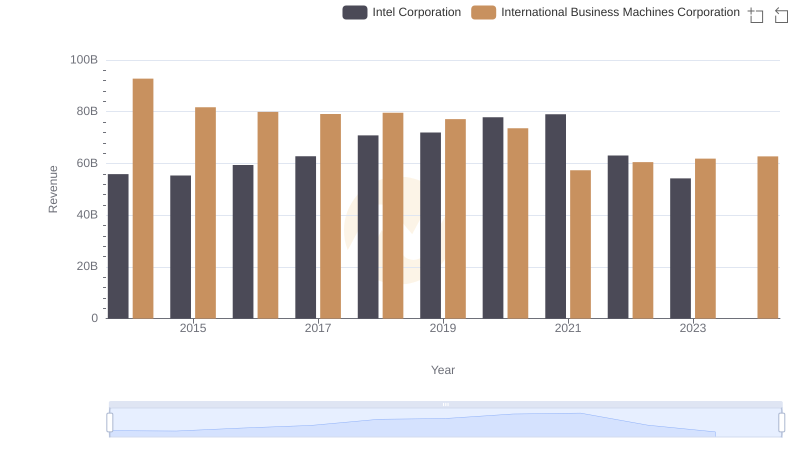
International Business Machines Corporation or Intel Corporation: Who Leads in Yearly Revenue?
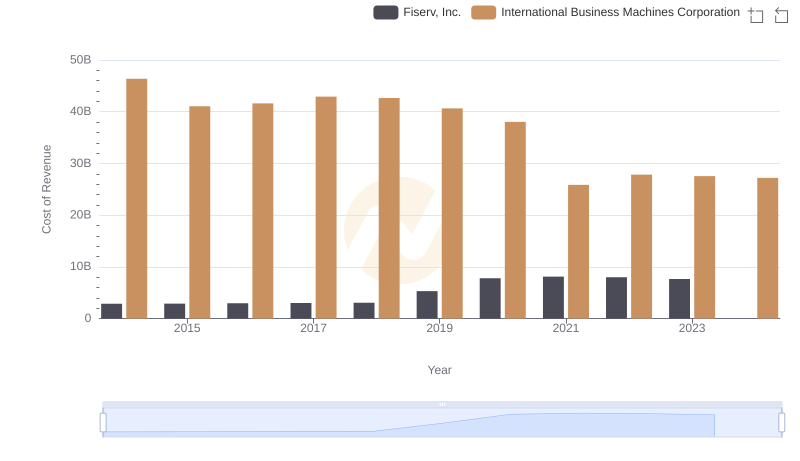
Analyzing Cost of Revenue: International Business Machines Corporation and Fiserv, Inc.
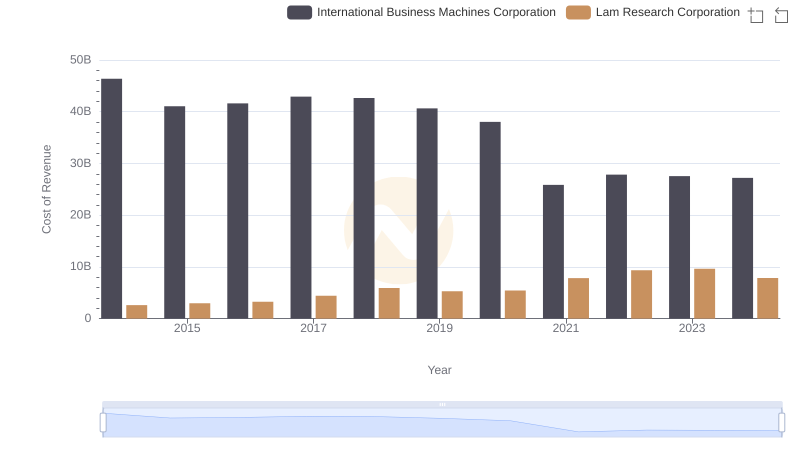
Analyzing Cost of Revenue: International Business Machines Corporation and Lam Research Corporation
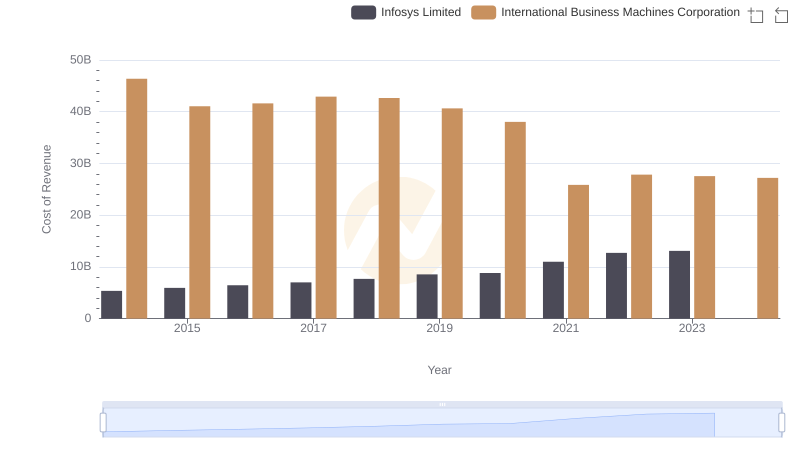
International Business Machines Corporation vs Infosys Limited: Efficiency in Cost of Revenue Explored
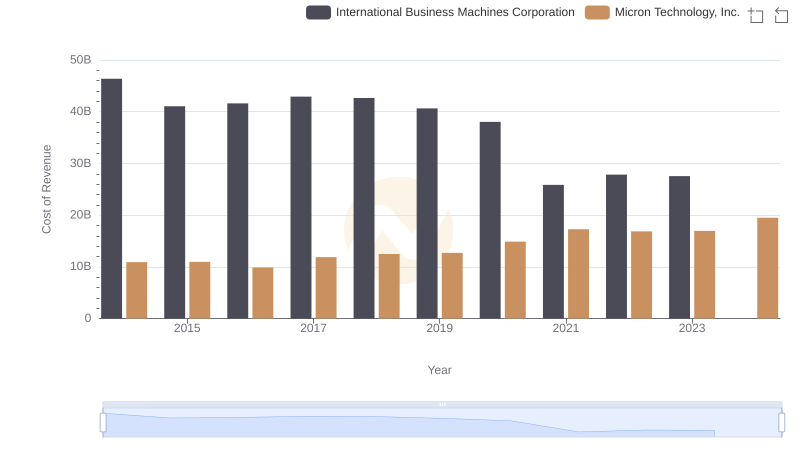
Cost of Revenue: Key Insights for International Business Machines Corporation and Micron Technology, Inc.
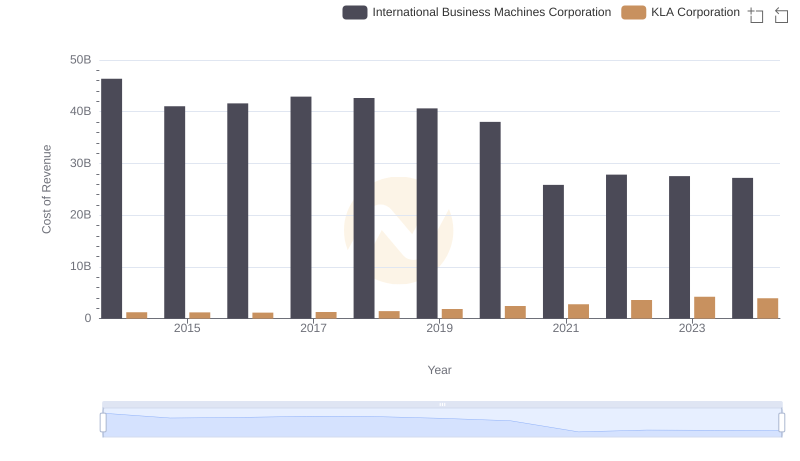
Cost Insights: Breaking Down International Business Machines Corporation and KLA Corporation's Expenses
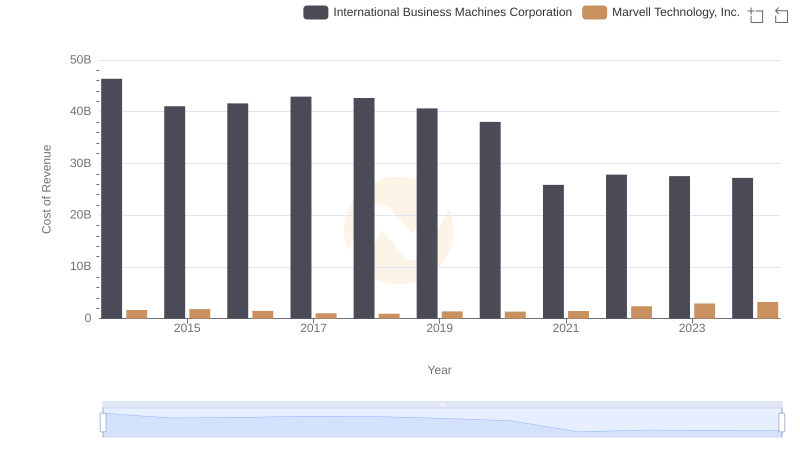
Cost Insights: Breaking Down International Business Machines Corporation and Marvell Technology, Inc.'s Expenses
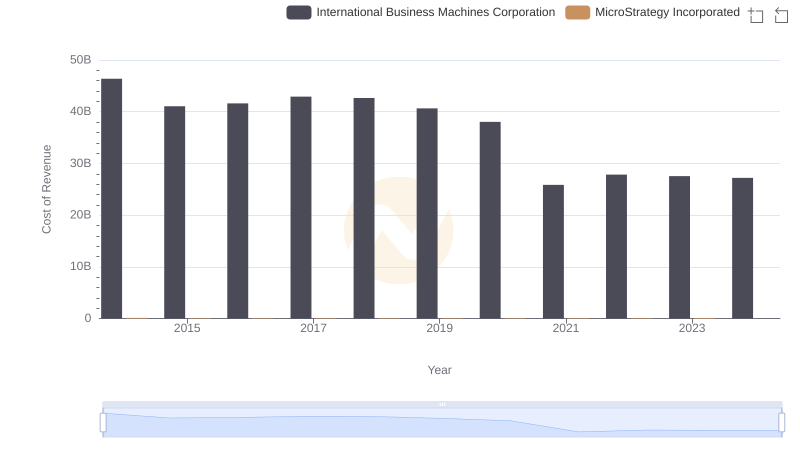
Cost of Revenue: Key Insights for International Business Machines Corporation and MicroStrategy Incorporated

Gross Profit Analysis: Comparing International Business Machines Corporation and Intel Corporation
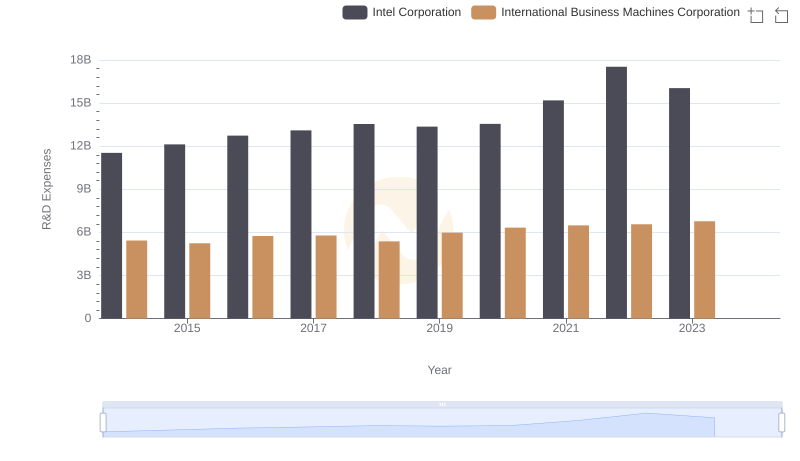
R&D Spending Showdown: International Business Machines Corporation vs Intel Corporation
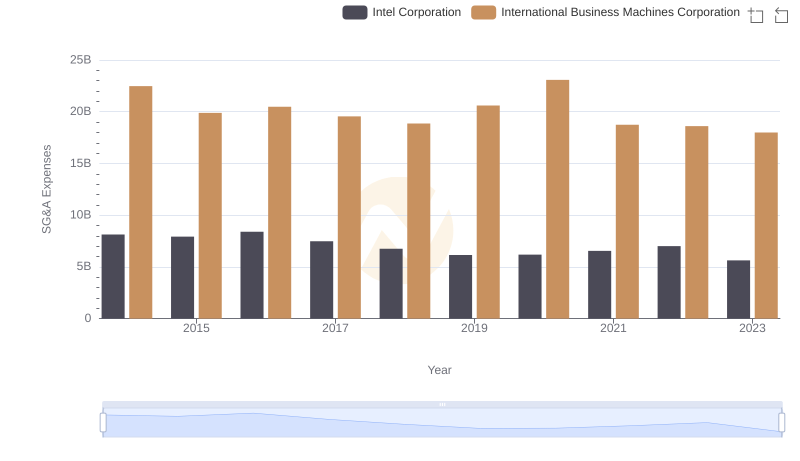
Selling, General, and Administrative Costs: International Business Machines Corporation vs Intel Corporation
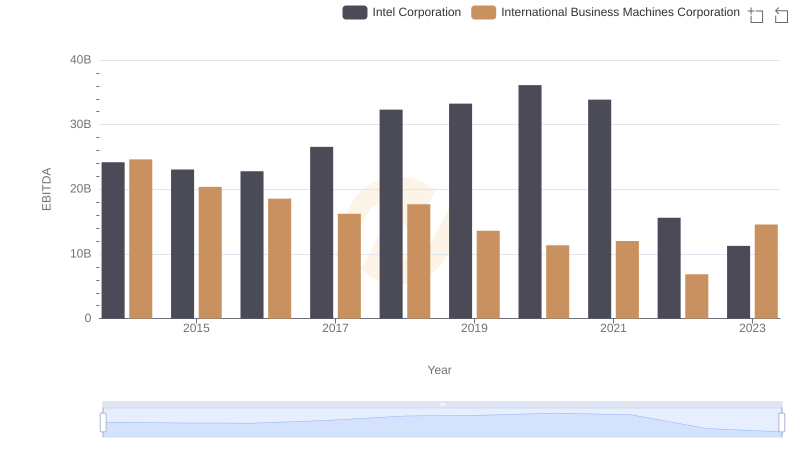
Comparative EBITDA Analysis: International Business Machines Corporation vs Intel Corporation