| __timestamp | Intel Corporation | International Business Machines Corporation |
|---|---|---|
| Wednesday, January 1, 2014 | 35609000000 | 46407000000 |
| Thursday, January 1, 2015 | 34679000000 | 40684000000 |
| Friday, January 1, 2016 | 36191000000 | 38516000000 |
| Sunday, January 1, 2017 | 39069000000 | 36943000000 |
| Monday, January 1, 2018 | 43737000000 | 36936000000 |
| Tuesday, January 1, 2019 | 42140000000 | 31533000000 |
| Wednesday, January 1, 2020 | 43612000000 | 30865000000 |
| Friday, January 1, 2021 | 43815000000 | 31486000000 |
| Saturday, January 1, 2022 | 26866000000 | 32687000000 |
| Sunday, January 1, 2023 | 21711000000 | 34300000000 |
| Monday, January 1, 2024 | 17345000000 | 35551000000 |
Data in motion
In the ever-evolving tech industry, the financial performance of giants like International Business Machines Corporation (IBM) and Intel Corporation offers valuable insights. From 2014 to 2023, IBM's gross profit showcased a steady decline, dropping approximately 26% from its peak in 2014. Meanwhile, Intel's gross profit experienced a more dramatic fall, plummeting nearly 39% over the same period.
These trends highlight the shifting dynamics in the tech industry, where strategic pivots and market demands significantly impact financial outcomes. Missing data for 2024 suggests ongoing changes, making future performance uncertain.
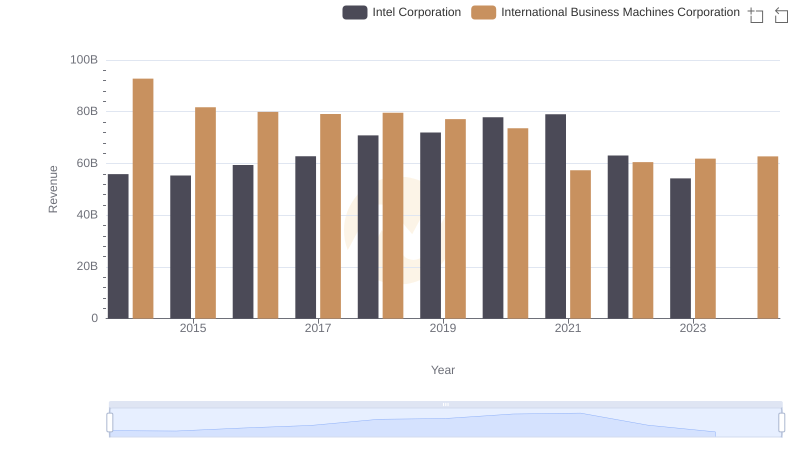
International Business Machines Corporation or Intel Corporation: Who Leads in Yearly Revenue?
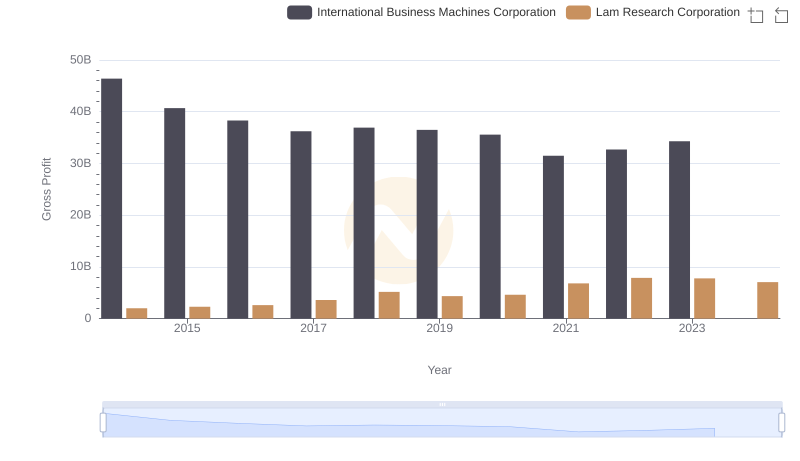
International Business Machines Corporation and Lam Research Corporation: A Detailed Gross Profit Analysis
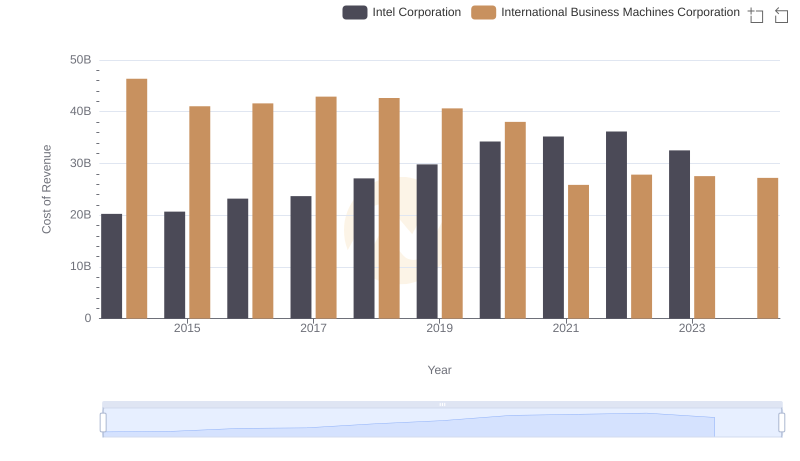
Cost Insights: Breaking Down International Business Machines Corporation and Intel Corporation's Expenses
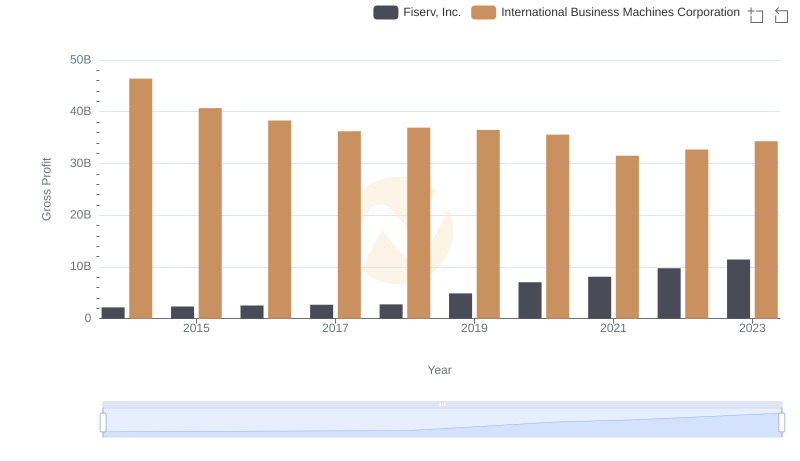
Key Insights on Gross Profit: International Business Machines Corporation vs Fiserv, Inc.
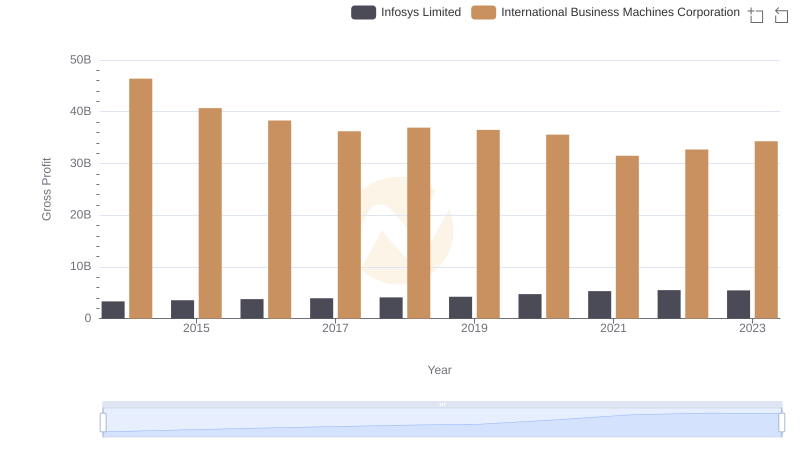
Key Insights on Gross Profit: International Business Machines Corporation vs Infosys Limited
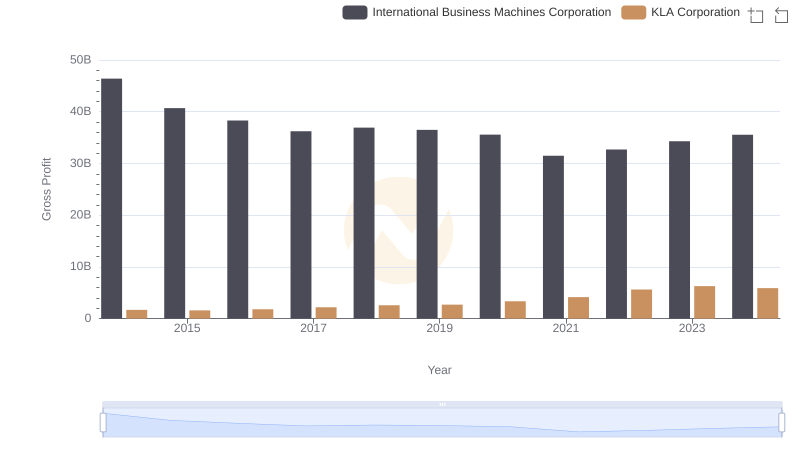
International Business Machines Corporation vs KLA Corporation: A Gross Profit Performance Breakdown
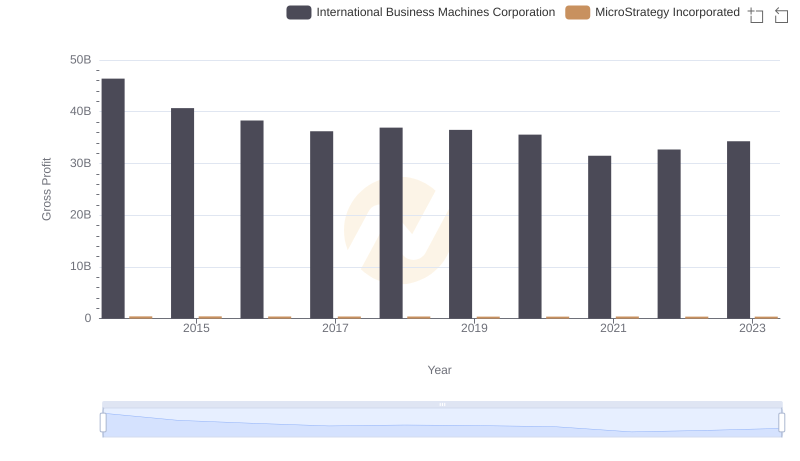
International Business Machines Corporation vs MicroStrategy Incorporated: A Gross Profit Performance Breakdown

Gross Profit Trends Compared: International Business Machines Corporation vs Marvell Technology, Inc.
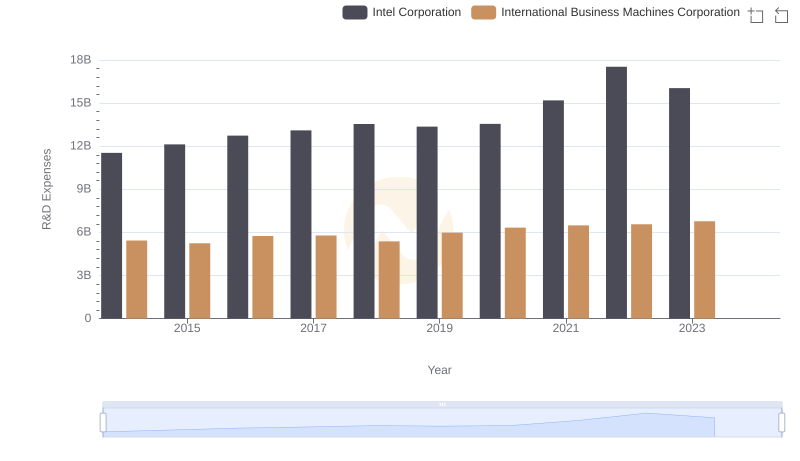
R&D Spending Showdown: International Business Machines Corporation vs Intel Corporation
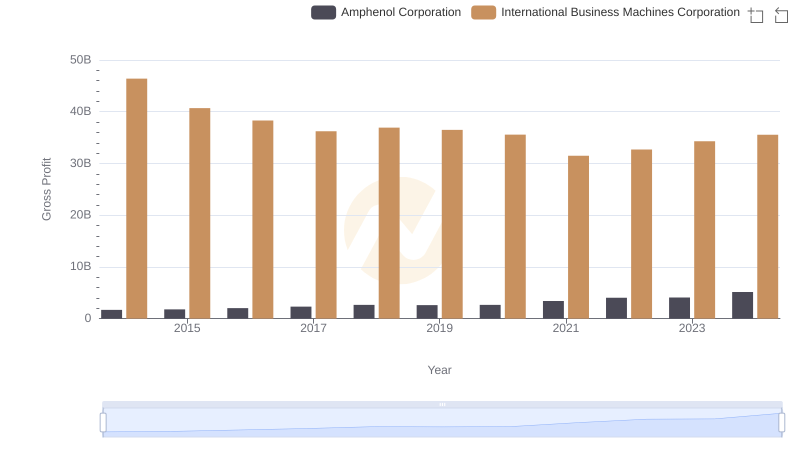
Who Generates Higher Gross Profit? International Business Machines Corporation or Amphenol Corporation
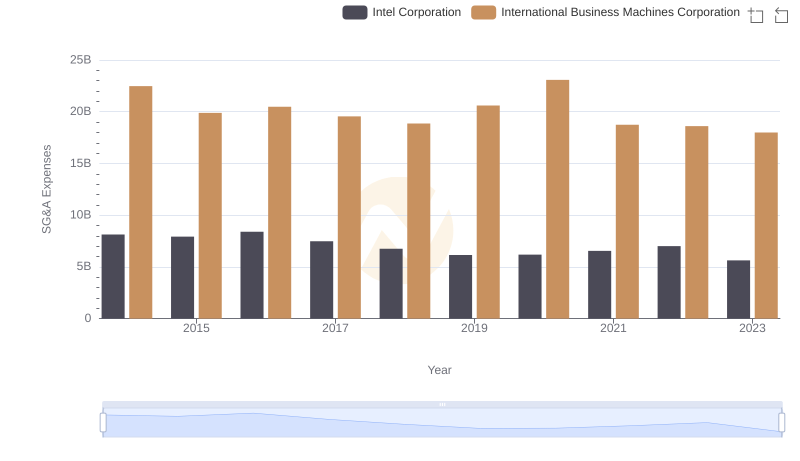
Selling, General, and Administrative Costs: International Business Machines Corporation vs Intel Corporation
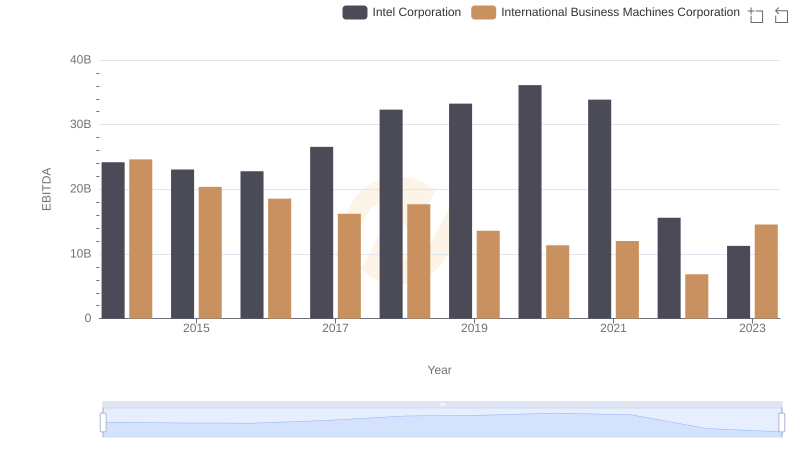
Comparative EBITDA Analysis: International Business Machines Corporation vs Intel Corporation