| __timestamp | Cintas Corporation | Rentokil Initial plc |
|---|---|---|
| Wednesday, January 1, 2014 | 1914386000 | 1443300000 |
| Thursday, January 1, 2015 | 1921337000 | 1448800000 |
| Friday, January 1, 2016 | 2129870000 | 1792000000 |
| Sunday, January 1, 2017 | 2380295000 | 1937400000 |
| Monday, January 1, 2018 | 2908523000 | 1958100000 |
| Tuesday, January 1, 2019 | 3128588000 | 577200000 |
| Wednesday, January 1, 2020 | 3233748000 | 653000000 |
| Friday, January 1, 2021 | 3314651000 | 714800000 |
| Saturday, January 1, 2022 | 3632246000 | 977000000 |
| Sunday, January 1, 2023 | 4173368000 | 4448000000 |
| Monday, January 1, 2024 | 4686416000 |
Unlocking the unknown
In the competitive landscape of business services, Cintas Corporation and Rentokil Initial plc have shown distinct trajectories in their gross profit trends over the past decade. Since 2014, Cintas has consistently outperformed Rentokil, with a remarkable growth of over 145% by 2023. This American company, known for its uniform and facility services, saw its gross profit rise from approximately $1.9 billion in 2014 to an impressive $4.2 billion in 2023. Meanwhile, Rentokil, a UK-based pest control and hygiene services provider, experienced a more volatile journey. Despite a significant surge in 2023, reaching a gross profit of $4.4 billion, Rentokil's growth was less steady, with notable dips in 2019 and 2020. The data highlights Cintas's robust growth strategy and Rentokil's resilience amidst market fluctuations, offering valuable insights into their financial health and strategic positioning.
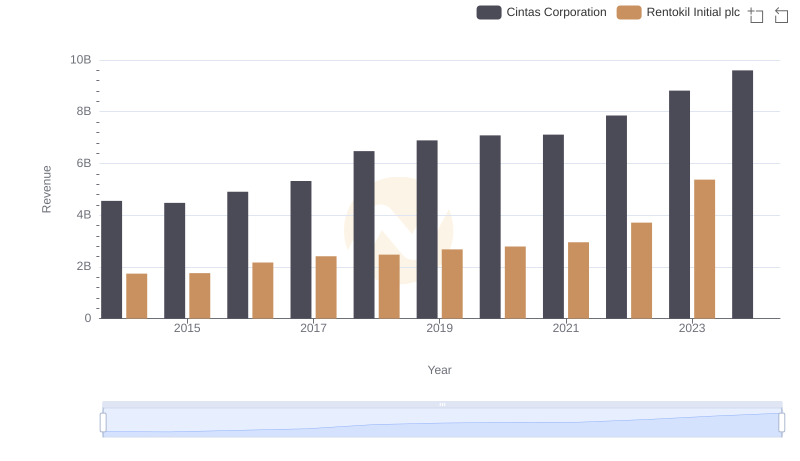
Cintas Corporation vs Rentokil Initial plc: Annual Revenue Growth Compared
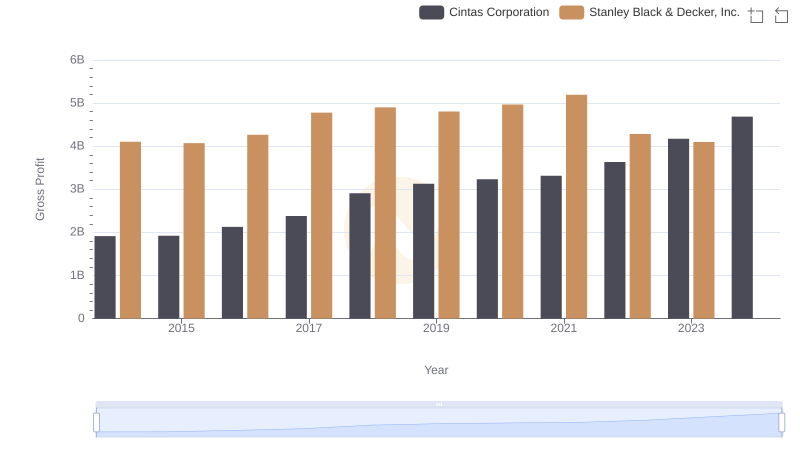
Key Insights on Gross Profit: Cintas Corporation vs Stanley Black & Decker, Inc.
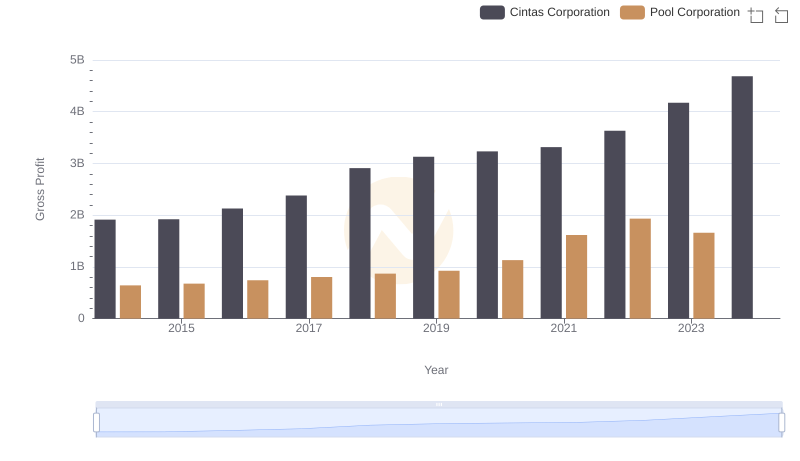
Who Generates Higher Gross Profit? Cintas Corporation or Pool Corporation
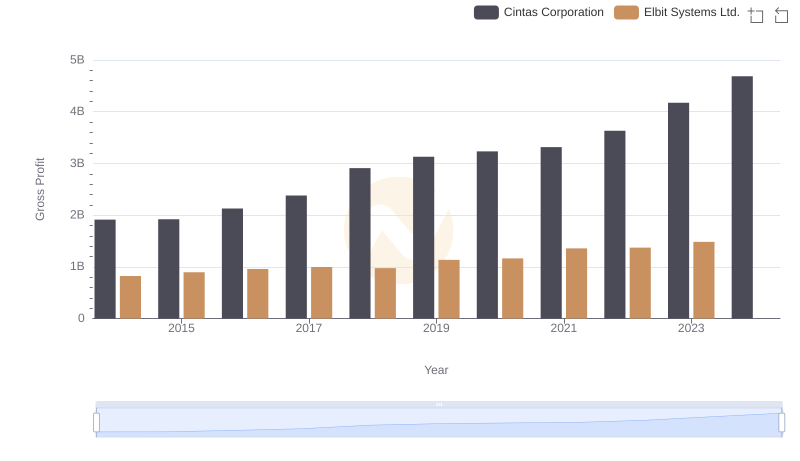
Gross Profit Trends Compared: Cintas Corporation vs Elbit Systems Ltd.
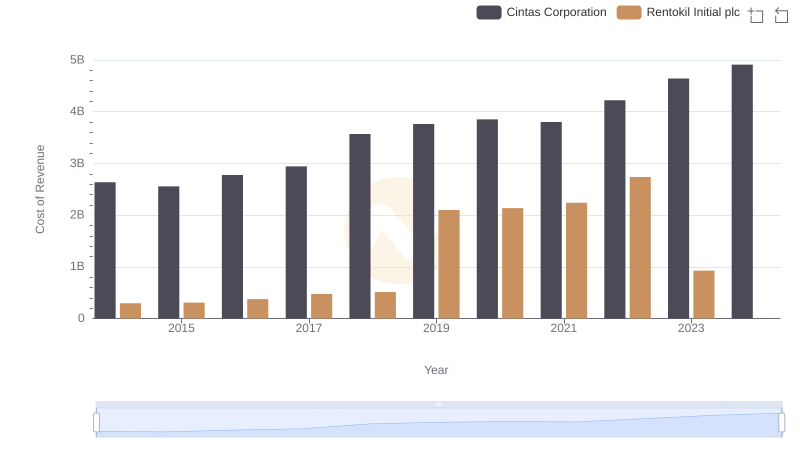
Cintas Corporation vs Rentokil Initial plc: Efficiency in Cost of Revenue Explored
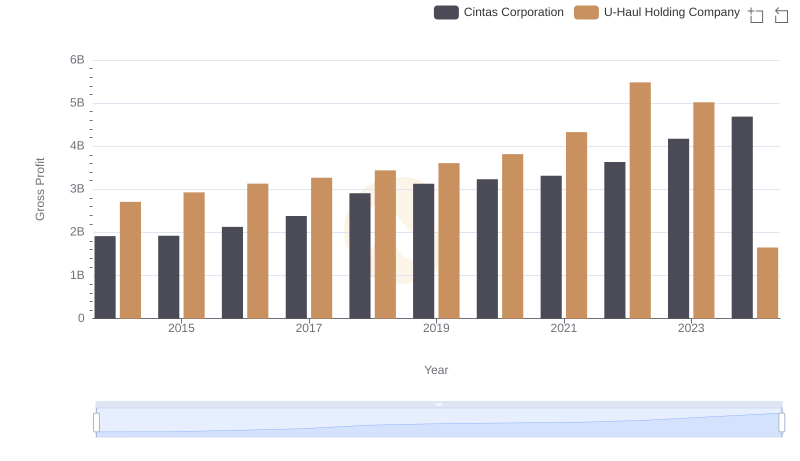
Gross Profit Analysis: Comparing Cintas Corporation and U-Haul Holding Company

Who Generates Higher Gross Profit? Cintas Corporation or Curtiss-Wright Corporation
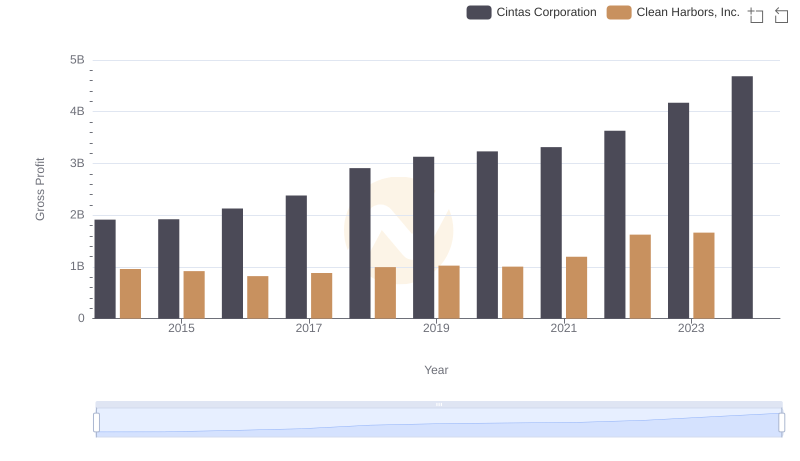
Gross Profit Trends Compared: Cintas Corporation vs Clean Harbors, Inc.
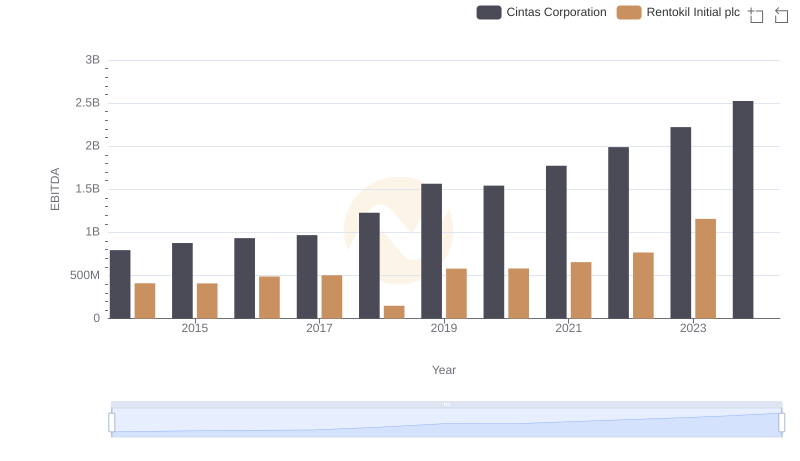
Comparative EBITDA Analysis: Cintas Corporation vs Rentokil Initial plc