| __timestamp | Cintas Corporation | Rentokil Initial plc |
|---|---|---|
| Wednesday, January 1, 2014 | 793811000 | 410400000 |
| Thursday, January 1, 2015 | 877761000 | 408700000 |
| Friday, January 1, 2016 | 933728000 | 489000000 |
| Sunday, January 1, 2017 | 968293000 | 503200000 |
| Monday, January 1, 2018 | 1227852000 | 149800000 |
| Tuesday, January 1, 2019 | 1564228000 | 580600000 |
| Wednesday, January 1, 2020 | 1542737000 | 581000000 |
| Friday, January 1, 2021 | 1773591000 | 656000000 |
| Saturday, January 1, 2022 | 1990046000 | 767000000 |
| Sunday, January 1, 2023 | 2221676000 | 1157000000 |
| Monday, January 1, 2024 | 2523857000 |
In pursuit of knowledge
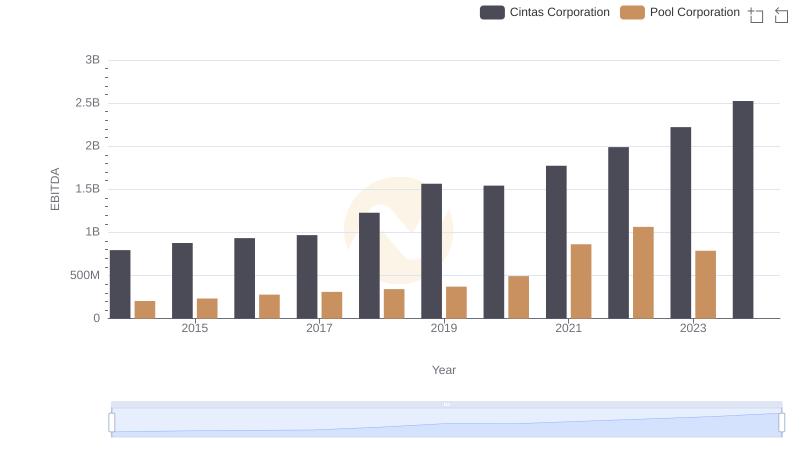
In the competitive landscape of business services, Cintas Corporation and Rentokil Initial plc have carved out significant niches. Over the past decade, Cintas has demonstrated a robust growth trajectory, with its EBITDA increasing by approximately 218% from 2014 to 2023. This growth underscores Cintas's strategic expansions and operational efficiencies. In contrast, Rentokil Initial plc, while showing a steady upward trend, has seen its EBITDA grow by about 182% over the same period. Notably, Rentokil's EBITDA in 2023 reached its peak, marking a 52% increase from 2020. However, data for 2024 is missing, leaving Rentokil's future performance open to speculation. This comparative analysis highlights the dynamic nature of the industry and the strategic maneuvers these companies employ to maintain their competitive edge.
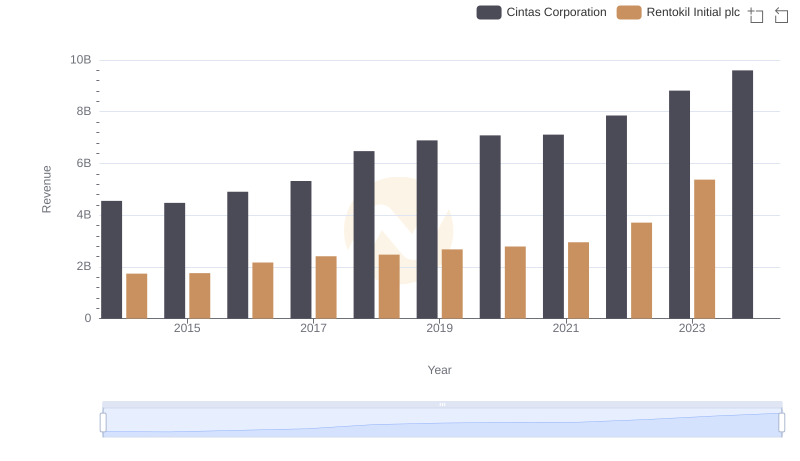
Cintas Corporation vs Rentokil Initial plc: Annual Revenue Growth Compared
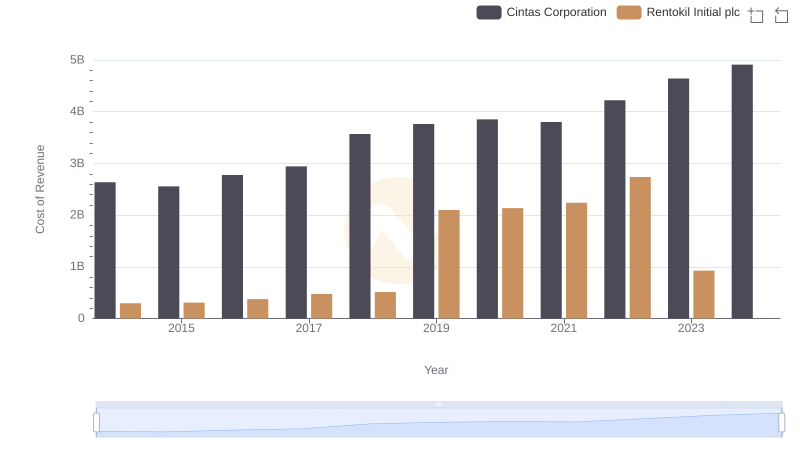
Cintas Corporation vs Rentokil Initial plc: Efficiency in Cost of Revenue Explored
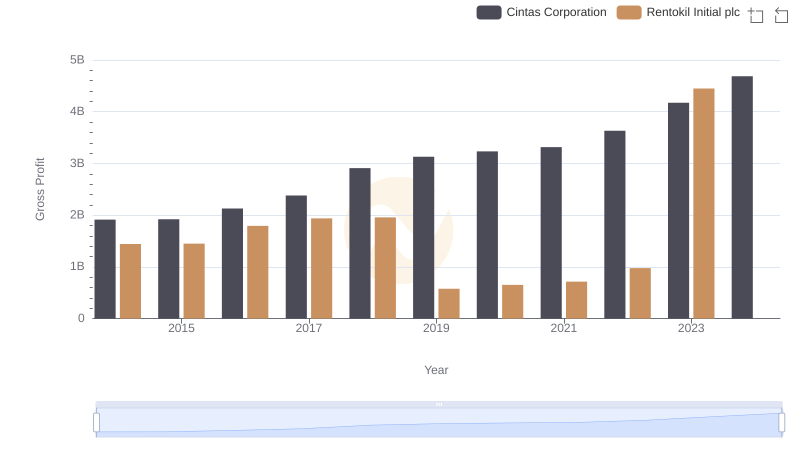
Gross Profit Trends Compared: Cintas Corporation vs Rentokil Initial plc
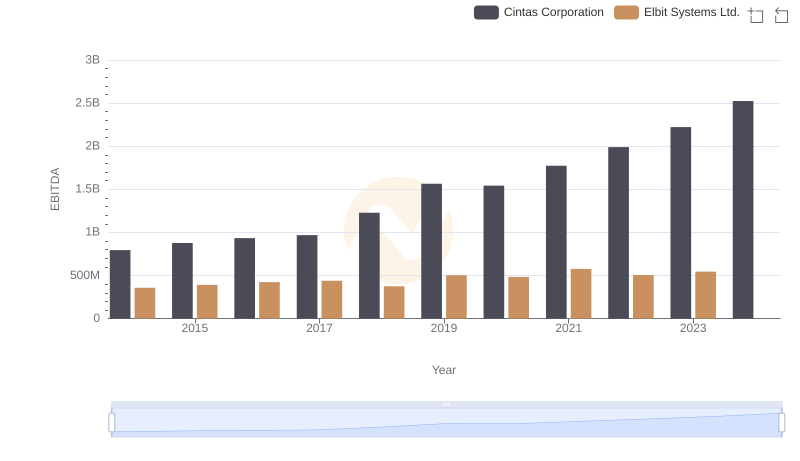
Comprehensive EBITDA Comparison: Cintas Corporation vs Elbit Systems Ltd.
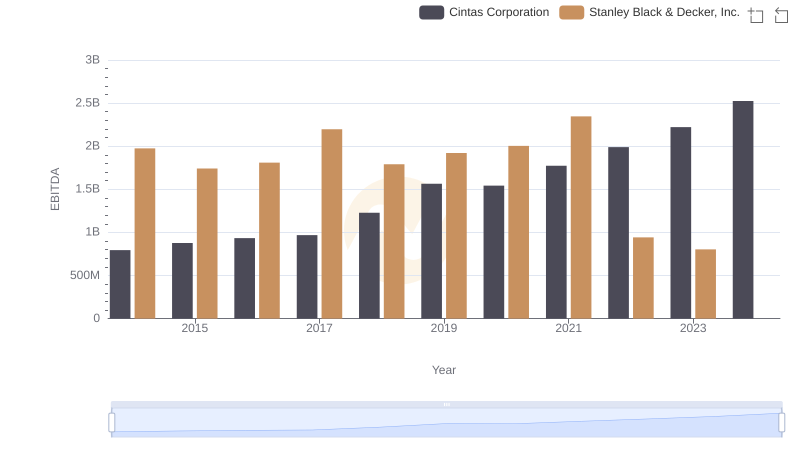
Comprehensive EBITDA Comparison: Cintas Corporation vs Stanley Black & Decker, Inc.
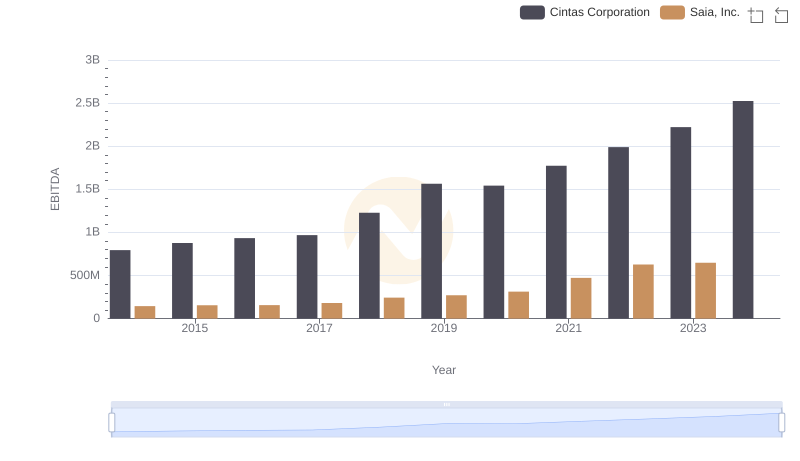
Cintas Corporation and Saia, Inc.: A Detailed Examination of EBITDA Performance
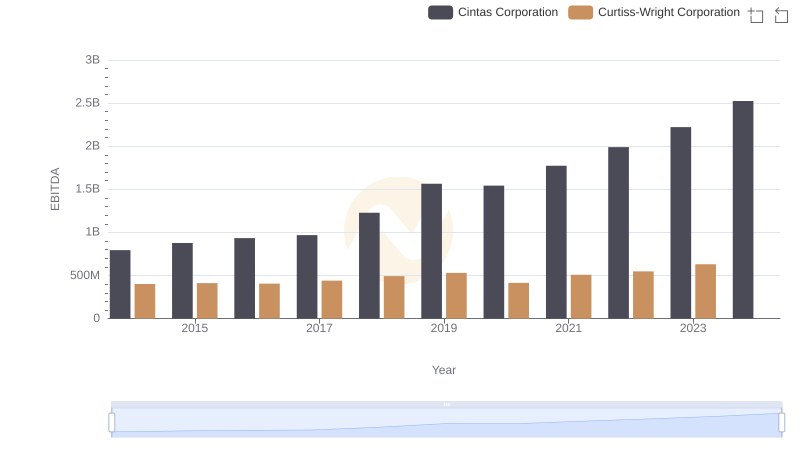
Comprehensive EBITDA Comparison: Cintas Corporation vs Curtiss-Wright Corporation
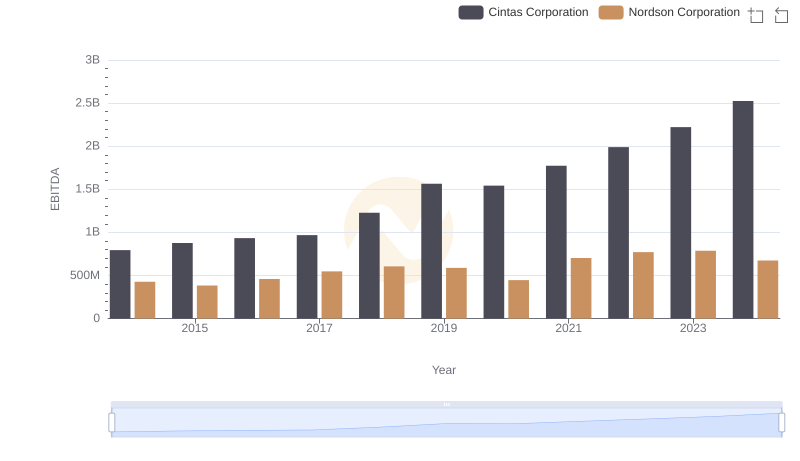
Comparative EBITDA Analysis: Cintas Corporation vs Nordson Corporation
Comparative EBITDA Analysis: Cintas Corporation vs Pool Corporation