| __timestamp | Cintas Corporation | Rentokil Initial plc |
|---|---|---|
| Wednesday, January 1, 2014 | 4551812000 | 1740800000 |
| Thursday, January 1, 2015 | 4476886000 | 1759000000 |
| Friday, January 1, 2016 | 4905458000 | 2168100000 |
| Sunday, January 1, 2017 | 5323381000 | 2412300000 |
| Monday, January 1, 2018 | 6476632000 | 2472300000 |
| Tuesday, January 1, 2019 | 6892303000 | 2676200000 |
| Wednesday, January 1, 2020 | 7085120000 | 2789400000 |
| Friday, January 1, 2021 | 7116340000 | 2953900000 |
| Saturday, January 1, 2022 | 7854459000 | 3714000000 |
| Sunday, January 1, 2023 | 8815769000 | 5375000000 |
| Monday, January 1, 2024 | 9596615000 |
Cracking the code
In the world of corporate growth, Cintas Corporation and Rentokil Initial plc have been on intriguing trajectories over the past decade. From 2014 to 2023, Cintas Corporation has seen its revenue soar by over 110%, reflecting a robust annual growth rate. In contrast, Rentokil Initial plc, while also experiencing growth, has seen its revenue increase by approximately 209% during the same period, albeit from a smaller base.
Cintas Corporation's revenue growth has been steady, with a notable jump in 2023, reaching nearly $9.6 billion. Rentokil Initial plc, on the other hand, has shown a more volatile pattern, with a significant leap in 2023, achieving a revenue of $5.4 billion. However, data for 2024 is missing for Rentokil, leaving a gap in the comparison.
These trends highlight the dynamic nature of the industry and the varying strategies employed by these two giants.
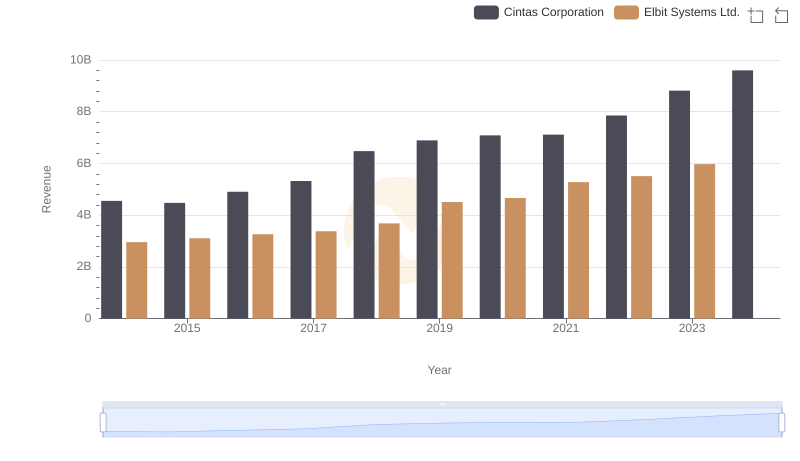
Who Generates More Revenue? Cintas Corporation or Elbit Systems Ltd.
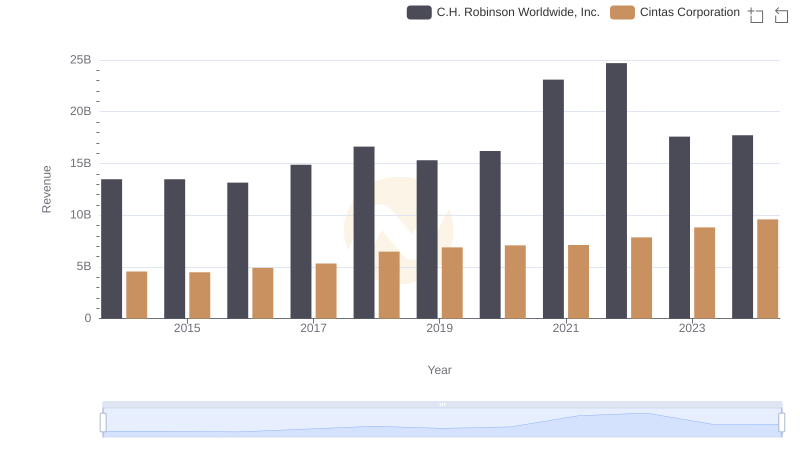
Revenue Showdown: Cintas Corporation vs C.H. Robinson Worldwide, Inc.
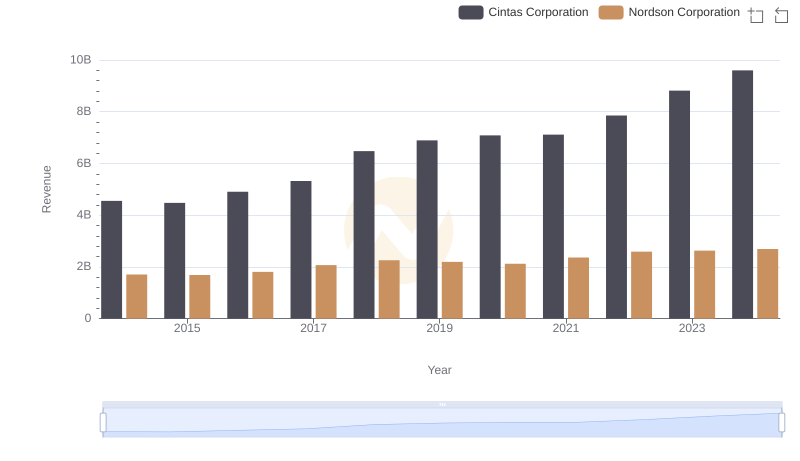
Cintas Corporation vs Nordson Corporation: Annual Revenue Growth Compared
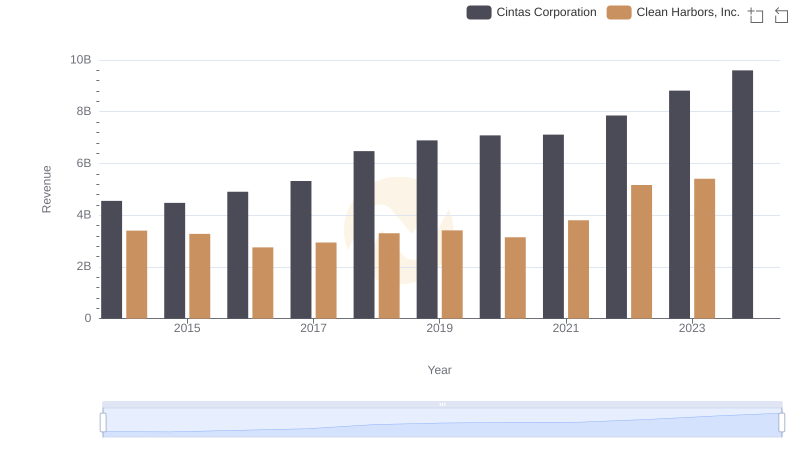
Revenue Insights: Cintas Corporation and Clean Harbors, Inc. Performance Compared
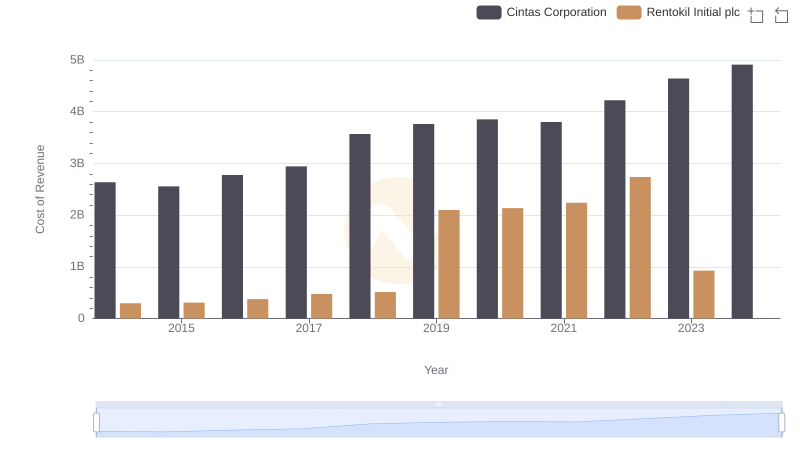
Cintas Corporation vs Rentokil Initial plc: Efficiency in Cost of Revenue Explored
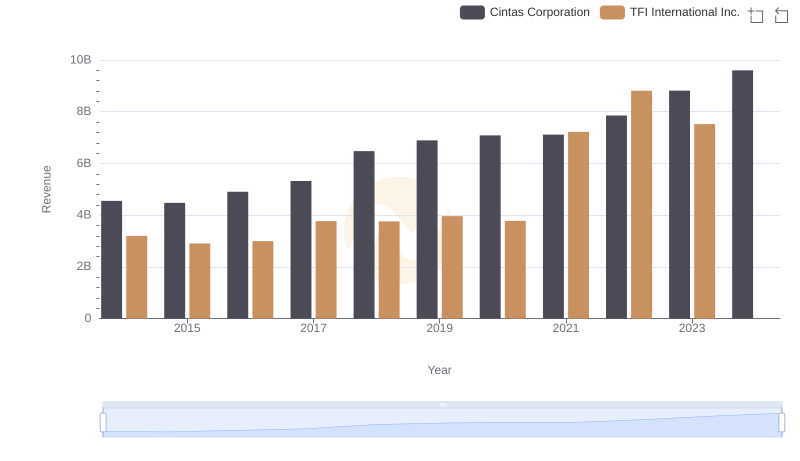
Cintas Corporation vs TFI International Inc.: Annual Revenue Growth Compared
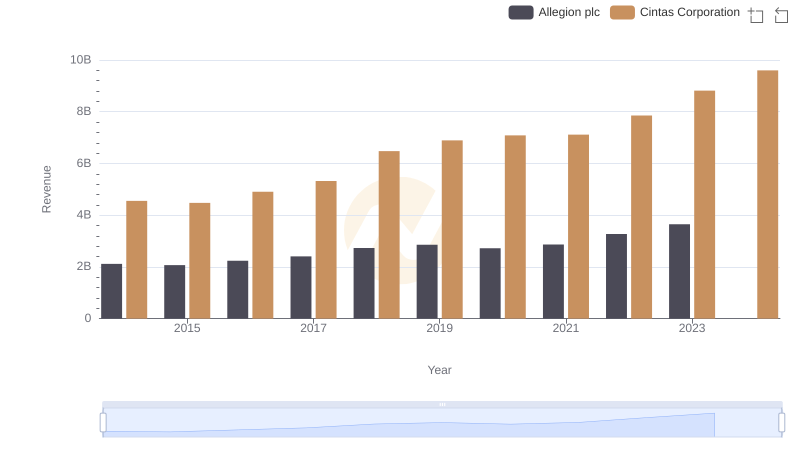
Annual Revenue Comparison: Cintas Corporation vs Allegion plc
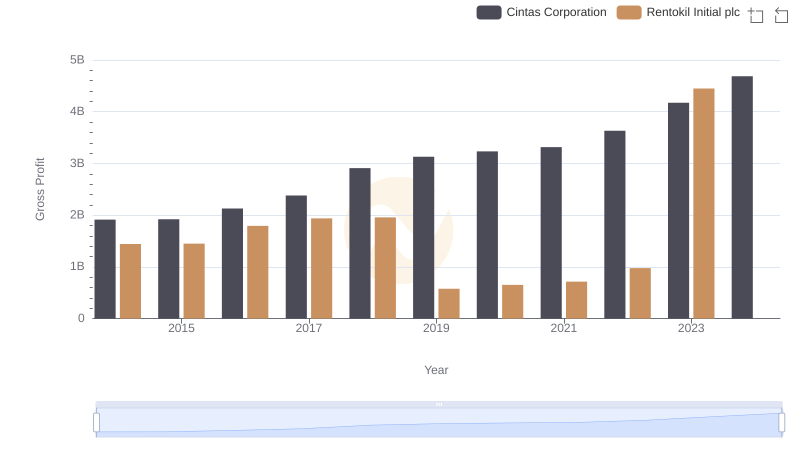
Gross Profit Trends Compared: Cintas Corporation vs Rentokil Initial plc
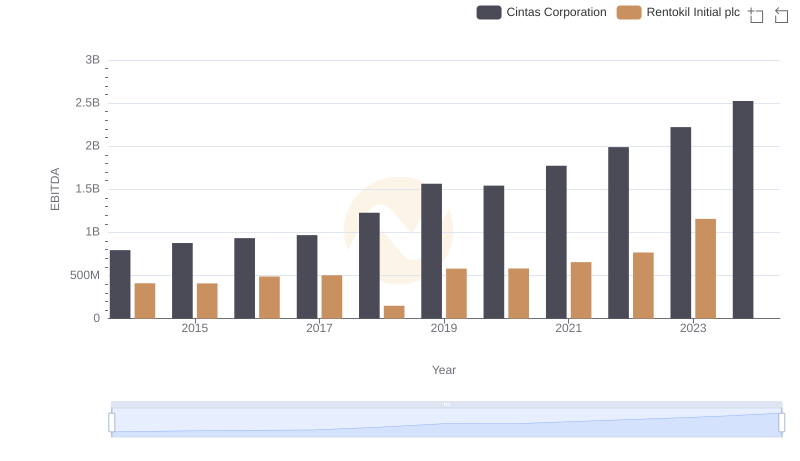
Comparative EBITDA Analysis: Cintas Corporation vs Rentokil Initial plc