| __timestamp | Cintas Corporation | Fastenal Company |
|---|---|---|
| Wednesday, January 1, 2014 | 2637426000 | 1836105000 |
| Thursday, January 1, 2015 | 2555549000 | 1920253000 |
| Friday, January 1, 2016 | 2775588000 | 1997259000 |
| Sunday, January 1, 2017 | 2943086000 | 2226900000 |
| Monday, January 1, 2018 | 3568109000 | 2566200000 |
| Tuesday, January 1, 2019 | 3763715000 | 2818300000 |
| Wednesday, January 1, 2020 | 3851372000 | 3079500000 |
| Friday, January 1, 2021 | 3801689000 | 3233700000 |
| Saturday, January 1, 2022 | 4222213000 | 3764800000 |
| Sunday, January 1, 2023 | 4642401000 | 3992200000 |
| Monday, January 1, 2024 | 4910199000 | 4144100000 |
Unlocking the unknown
In the competitive landscape of industrial services and supplies, Cintas Corporation and Fastenal Company have been pivotal players. Over the past decade, from 2014 to 2024, these companies have shown remarkable trends in their cost of revenue, a critical metric reflecting the direct costs attributable to the production of goods sold by a company.
Cintas Corporation has experienced a consistent upward trajectory in its cost of revenue, growing by approximately 86% from 2014 to 2024. This increase reflects the company's expanding operations and market reach, with notable jumps in 2018 and 2022.
Fastenal Company, while starting with a lower cost of revenue, has also seen a significant rise of about 126% over the same period. This growth underscores Fastenal's strategic expansion and increased market penetration.
Both companies illustrate the dynamic nature of the industrial sector, adapting and thriving amidst economic shifts.
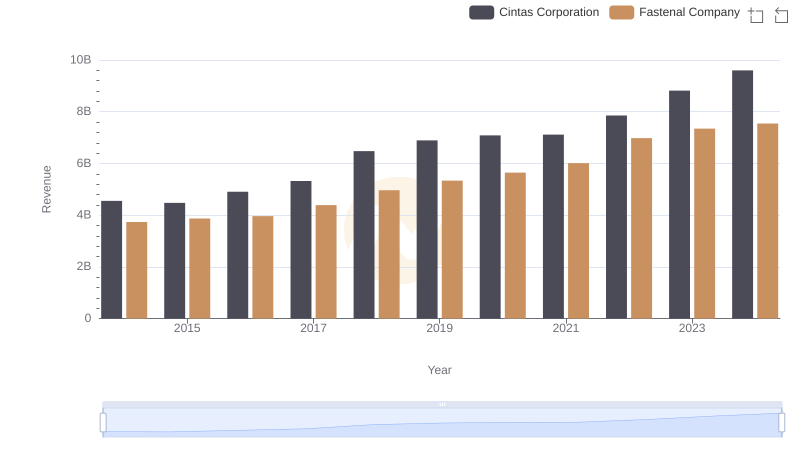
Cintas Corporation vs Fastenal Company: Examining Key Revenue Metrics
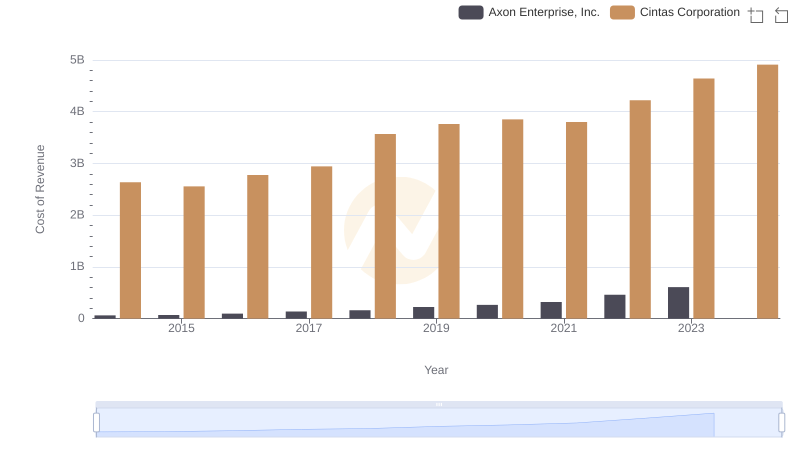
Cost of Revenue: Key Insights for Cintas Corporation and Axon Enterprise, Inc.
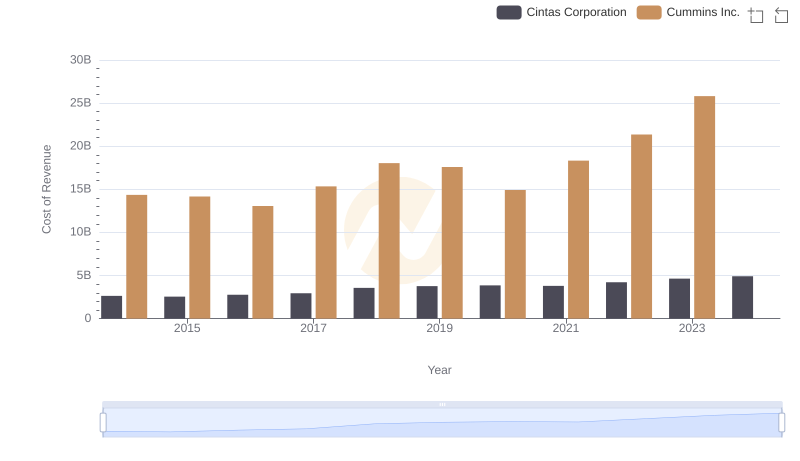
Cost Insights: Breaking Down Cintas Corporation and Cummins Inc.'s Expenses
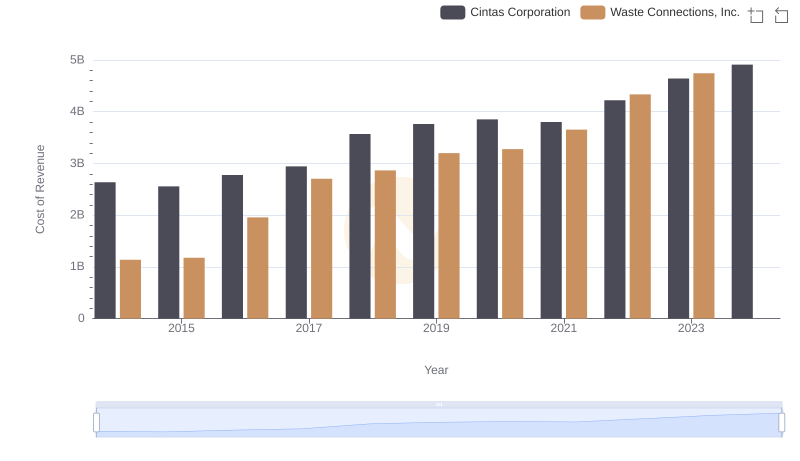
Cost of Revenue Comparison: Cintas Corporation vs Waste Connections, Inc.
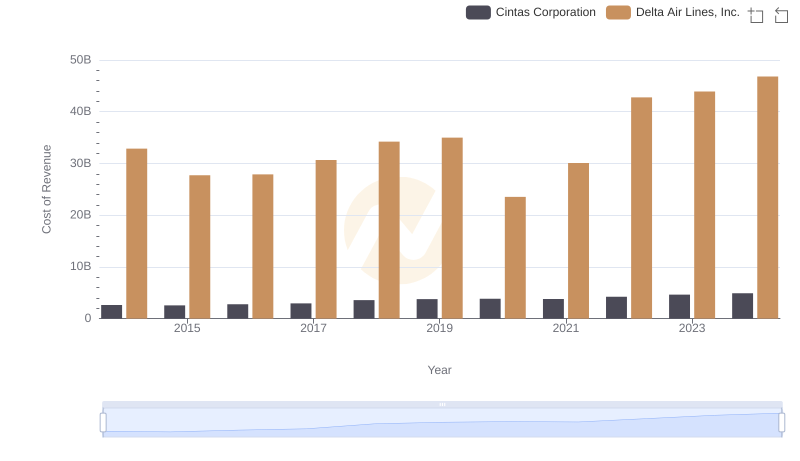
Cost Insights: Breaking Down Cintas Corporation and Delta Air Lines, Inc.'s Expenses
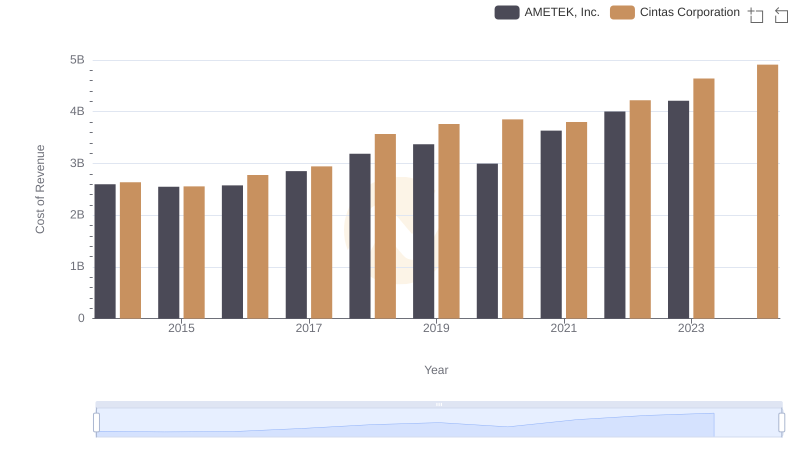
Analyzing Cost of Revenue: Cintas Corporation and AMETEK, Inc.
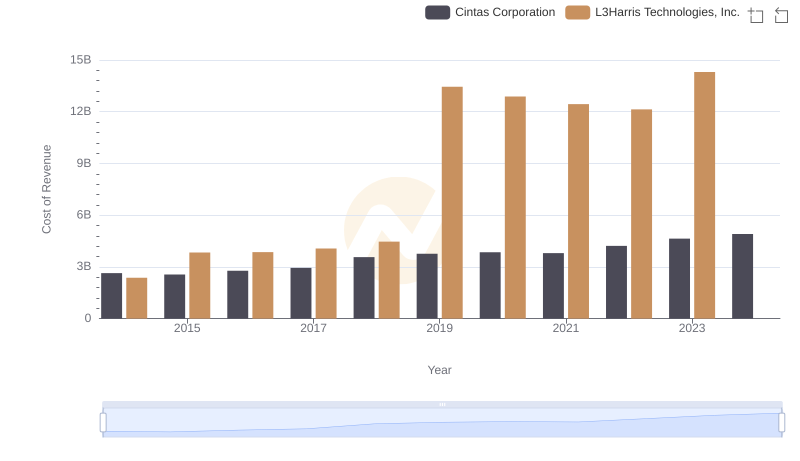
Analyzing Cost of Revenue: Cintas Corporation and L3Harris Technologies, Inc.
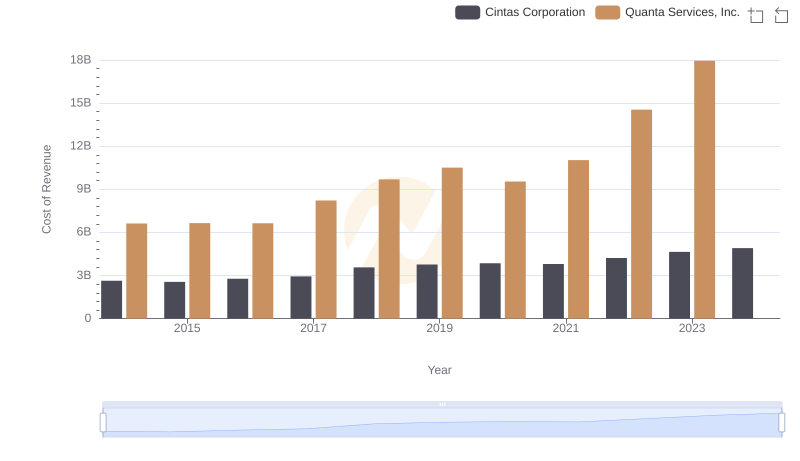
Analyzing Cost of Revenue: Cintas Corporation and Quanta Services, Inc.
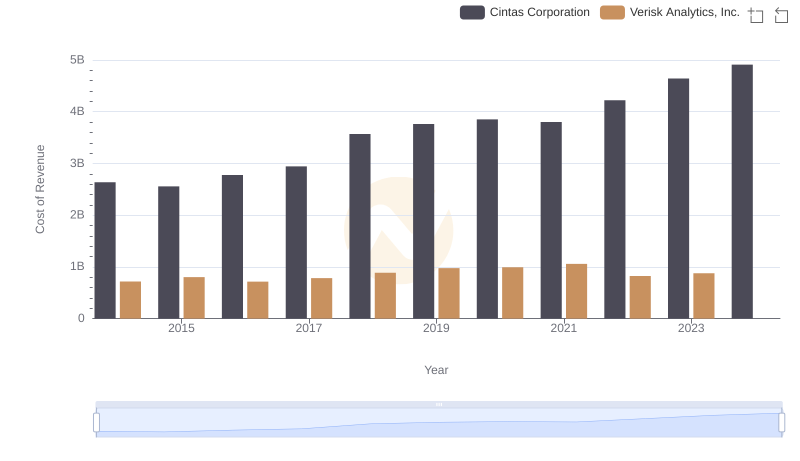
Cost Insights: Breaking Down Cintas Corporation and Verisk Analytics, Inc.'s Expenses
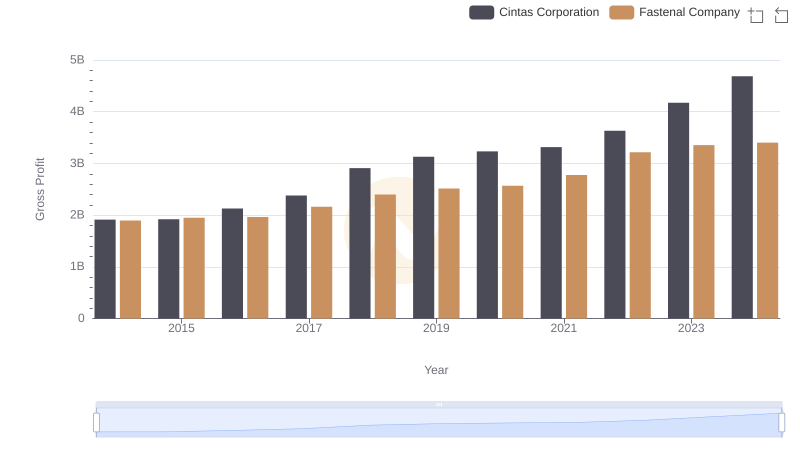
Key Insights on Gross Profit: Cintas Corporation vs Fastenal Company
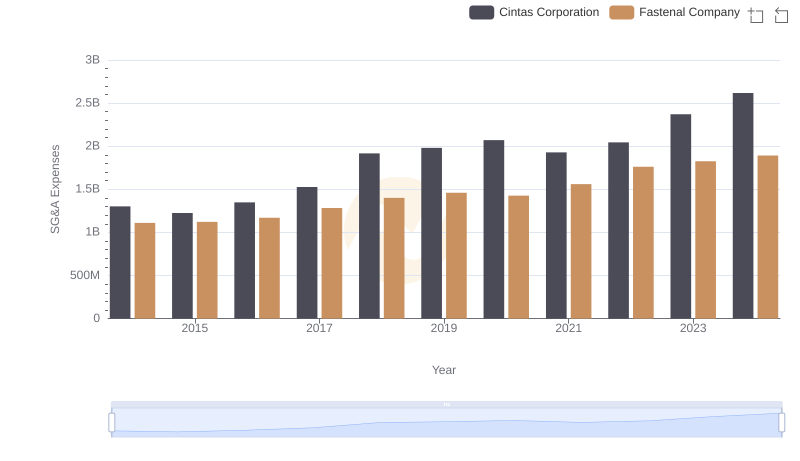
Cintas Corporation vs Fastenal Company: SG&A Expense Trends
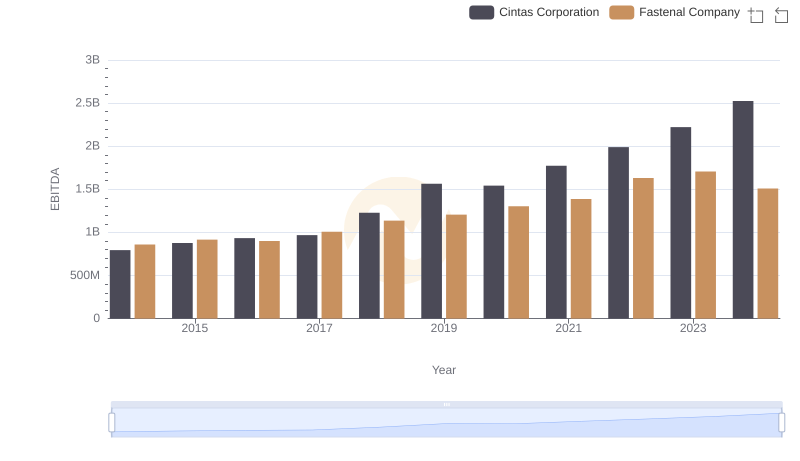
EBITDA Analysis: Evaluating Cintas Corporation Against Fastenal Company