| __timestamp | AMETEK, Inc. | Cintas Corporation |
|---|---|---|
| Wednesday, January 1, 2014 | 4021964000 | 4551812000 |
| Thursday, January 1, 2015 | 3974295000 | 4476886000 |
| Friday, January 1, 2016 | 3840087000 | 4905458000 |
| Sunday, January 1, 2017 | 4300170000 | 5323381000 |
| Monday, January 1, 2018 | 4845872000 | 6476632000 |
| Tuesday, January 1, 2019 | 5158557000 | 6892303000 |
| Wednesday, January 1, 2020 | 4540029000 | 7085120000 |
| Friday, January 1, 2021 | 5546514000 | 7116340000 |
| Saturday, January 1, 2022 | 6150530000 | 7854459000 |
| Sunday, January 1, 2023 | 6596950000 | 8815769000 |
| Monday, January 1, 2024 | 6941180000 | 9596615000 |
Unleashing insights
In the competitive landscape of industrial services and manufacturing, Cintas Corporation and AMETEK, Inc. have emerged as formidable players. Over the past decade, Cintas has consistently outpaced AMETEK in revenue growth, showcasing a robust upward trajectory. From 2014 to 2023, Cintas' revenue surged by approximately 94%, reaching nearly $8.8 billion in 2023. In contrast, AMETEK's revenue grew by about 64% during the same period, peaking at $6.6 billion.
The data reveals a compelling narrative of strategic growth and market adaptation. Cintas' ability to nearly double its revenue highlights its effective business strategies and market penetration. Meanwhile, AMETEK's steady growth underscores its resilience and adaptability in a dynamic market. As we look to the future, the missing data for 2024 suggests an opportunity for both companies to redefine their trajectories and continue their legacy of excellence.
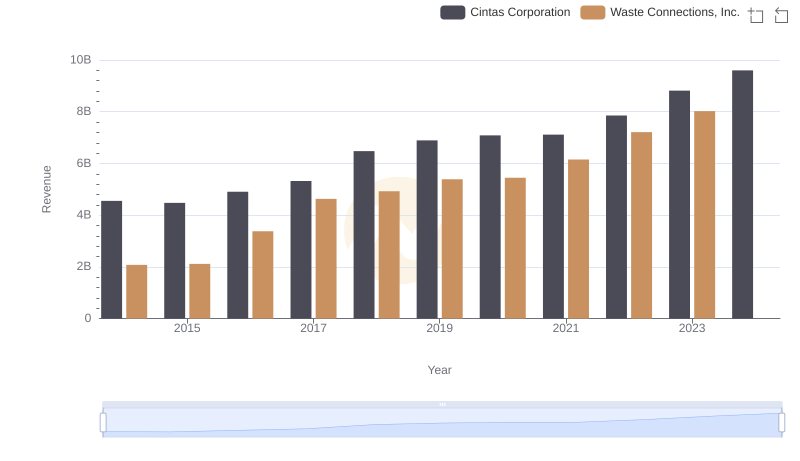
Cintas Corporation and Waste Connections, Inc.: A Comprehensive Revenue Analysis
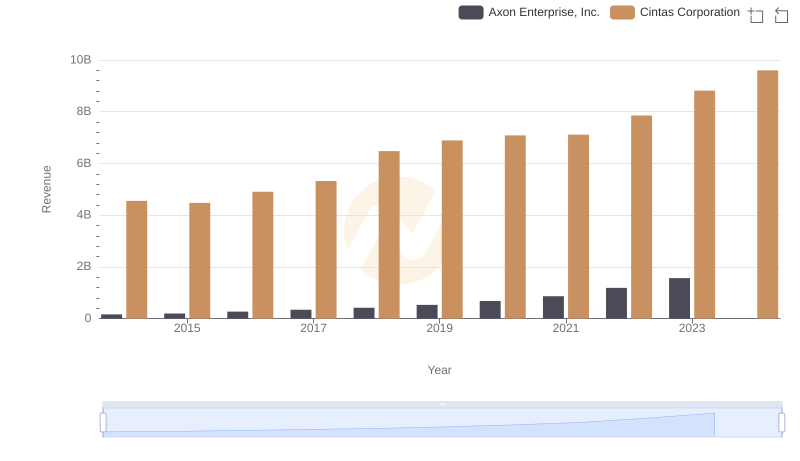
Cintas Corporation vs Axon Enterprise, Inc.: Annual Revenue Growth Compared
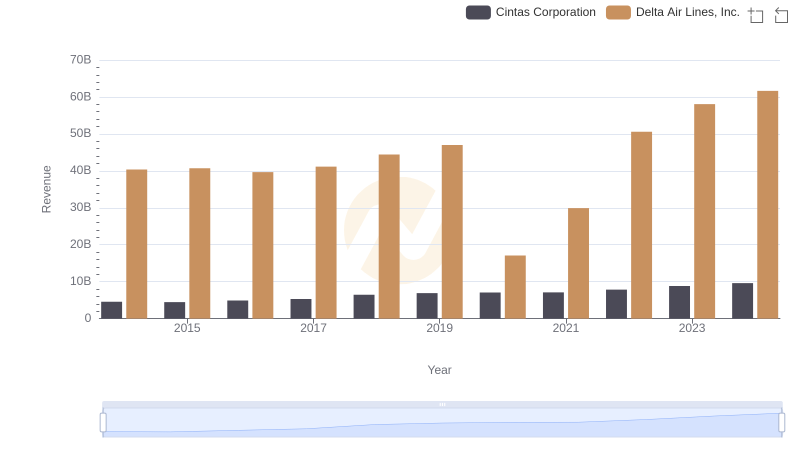
Who Generates More Revenue? Cintas Corporation or Delta Air Lines, Inc.
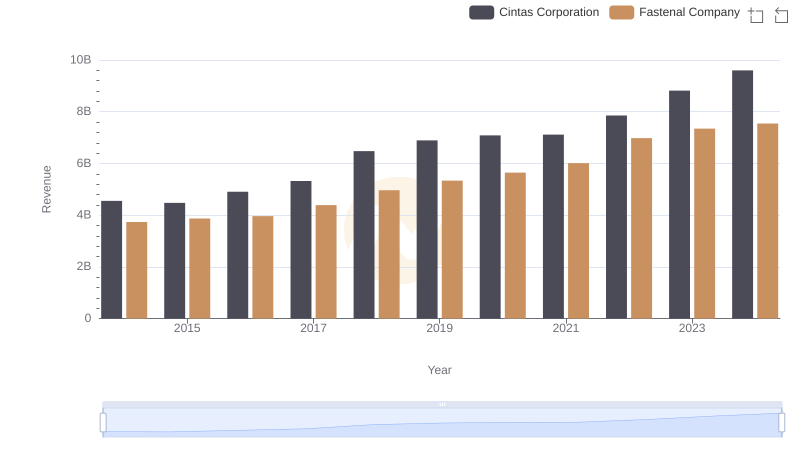
Cintas Corporation vs Fastenal Company: Examining Key Revenue Metrics
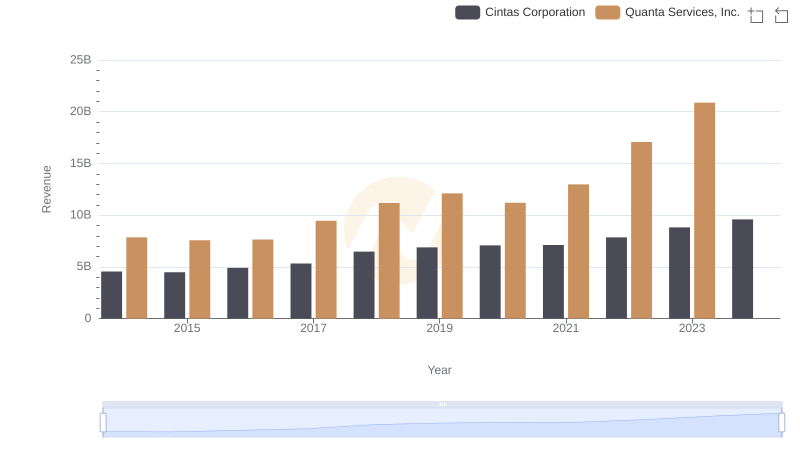
Who Generates More Revenue? Cintas Corporation or Quanta Services, Inc.
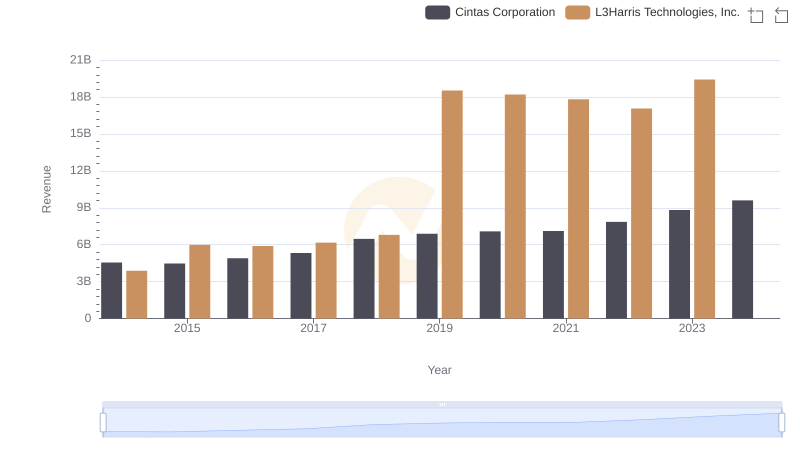
Cintas Corporation and L3Harris Technologies, Inc.: A Comprehensive Revenue Analysis
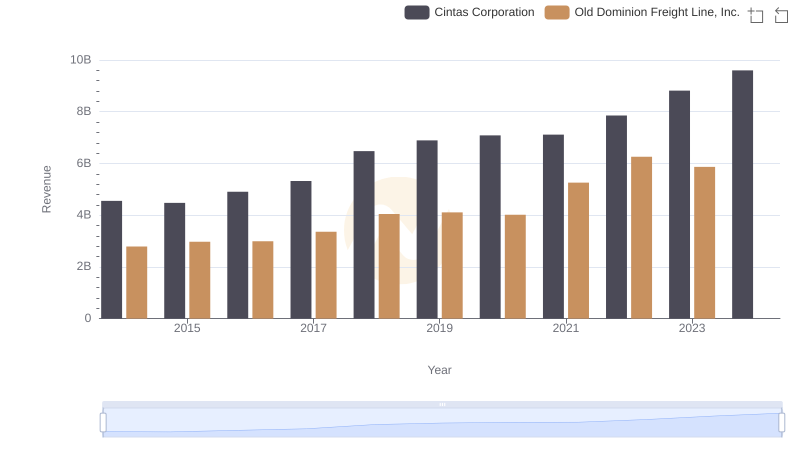
Revenue Insights: Cintas Corporation and Old Dominion Freight Line, Inc. Performance Compared
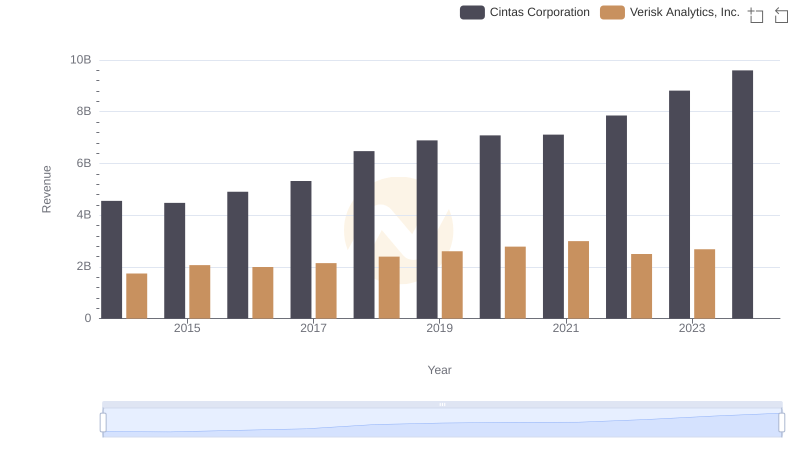
Comparing Revenue Performance: Cintas Corporation or Verisk Analytics, Inc.?
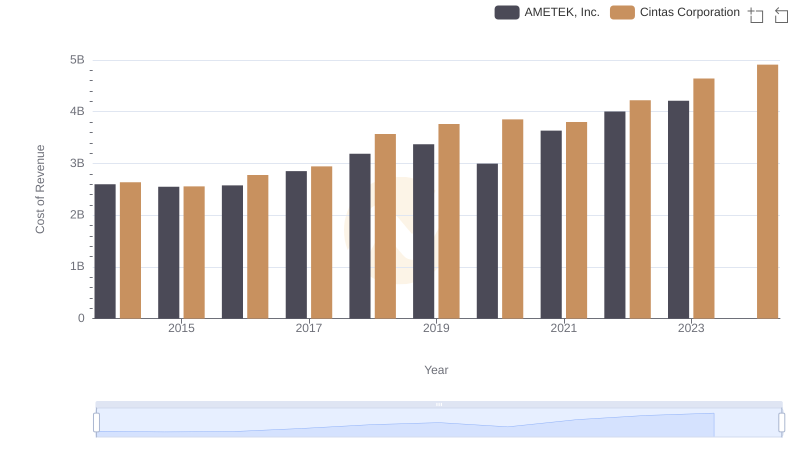
Analyzing Cost of Revenue: Cintas Corporation and AMETEK, Inc.
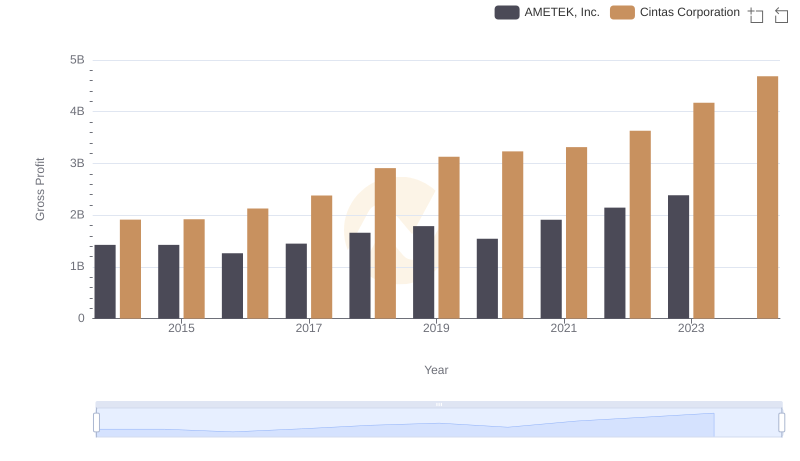
Cintas Corporation vs AMETEK, Inc.: A Gross Profit Performance Breakdown
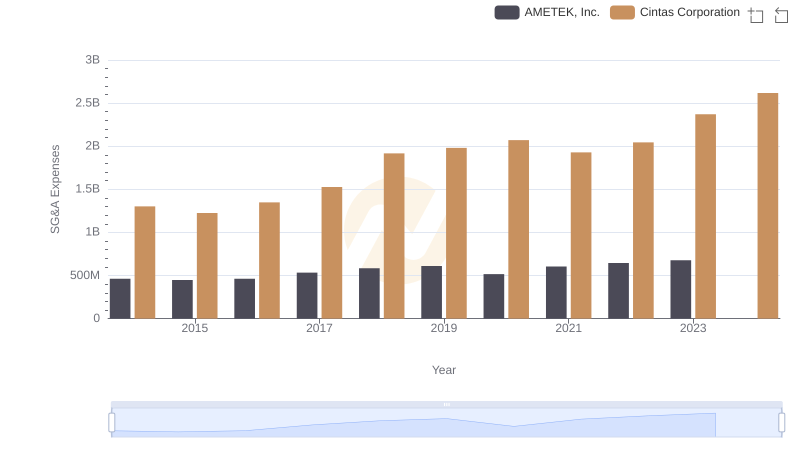
Cintas Corporation vs AMETEK, Inc.: SG&A Expense Trends
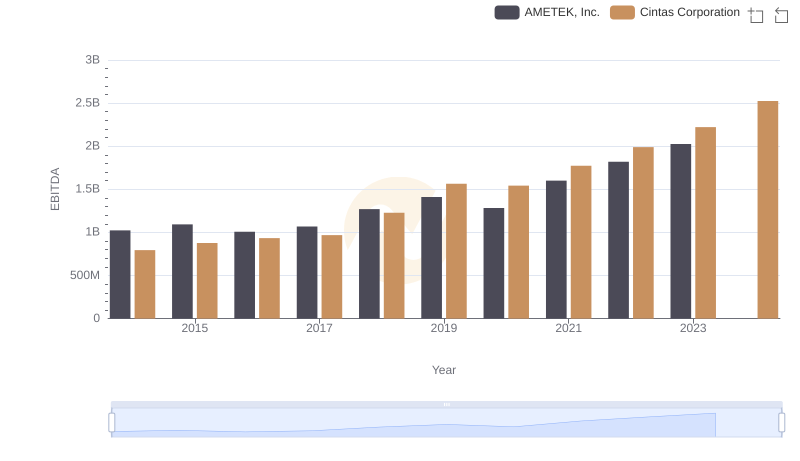
Cintas Corporation vs AMETEK, Inc.: In-Depth EBITDA Performance Comparison