| __timestamp | Cintas Corporation | Global Payments Inc. |
|---|---|---|
| Wednesday, January 1, 2014 | 4551812000 | 2773718000 |
| Thursday, January 1, 2015 | 4476886000 | 2898150000 |
| Friday, January 1, 2016 | 4905458000 | 3370976000 |
| Sunday, January 1, 2017 | 5323381000 | 3975163000 |
| Monday, January 1, 2018 | 6476632000 | 3366366000 |
| Tuesday, January 1, 2019 | 6892303000 | 4911892000 |
| Wednesday, January 1, 2020 | 7085120000 | 7423558000 |
| Friday, January 1, 2021 | 7116340000 | 8523762000 |
| Saturday, January 1, 2022 | 7854459000 | 8975515000 |
| Sunday, January 1, 2023 | 8815769000 | 9654419000 |
| Monday, January 1, 2024 | 9596615000 | 10105894000 |
Data in motion
In the ever-evolving landscape of corporate revenue, Cintas Corporation and Global Payments Inc. have emerged as formidable contenders. Over the past decade, Cintas has seen its revenue grow by approximately 111%, starting from 2014 to 2023. Meanwhile, Global Payments Inc. has experienced an impressive surge of around 248% during the same period.
Cintas Corporation, known for its uniform and facility services, has consistently increased its revenue, peaking in 2024 with a remarkable 9.6 billion dollars. On the other hand, Global Payments Inc., a leader in payment technology services, reached its highest revenue in 2023, with a staggering 9.7 billion dollars.
While Cintas continues its upward trajectory into 2024, data for Global Payments Inc. is not available for this year, leaving room for speculation on its future performance. This comparison highlights the dynamic nature of these industries and the potential for growth in the coming years.
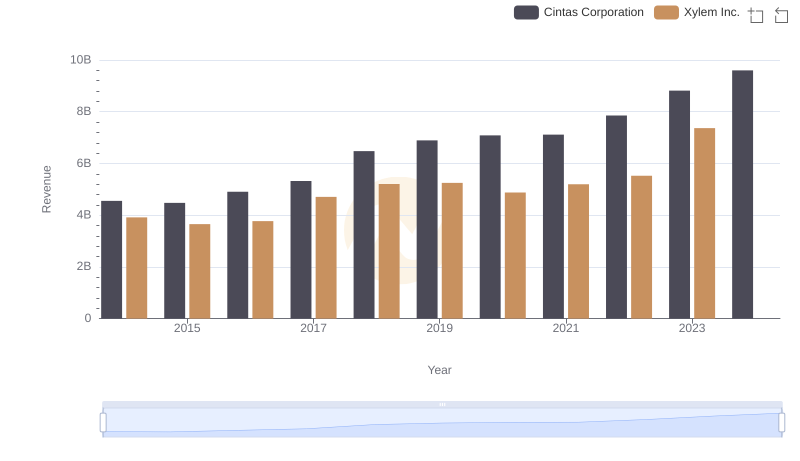
Breaking Down Revenue Trends: Cintas Corporation vs Xylem Inc.
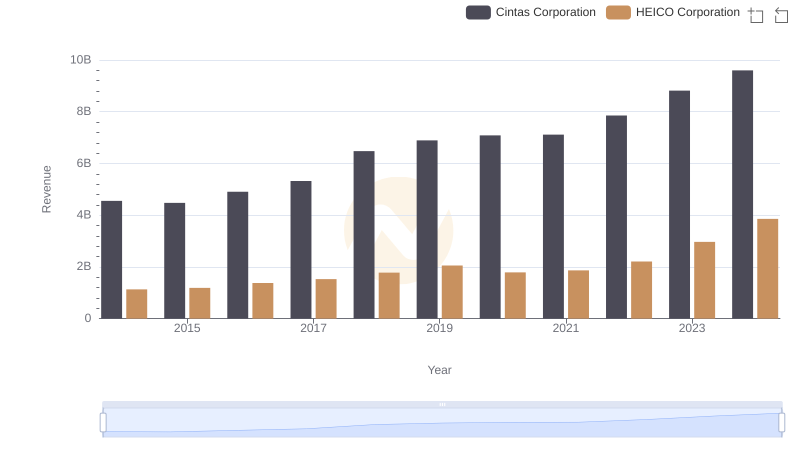
Breaking Down Revenue Trends: Cintas Corporation vs HEICO Corporation
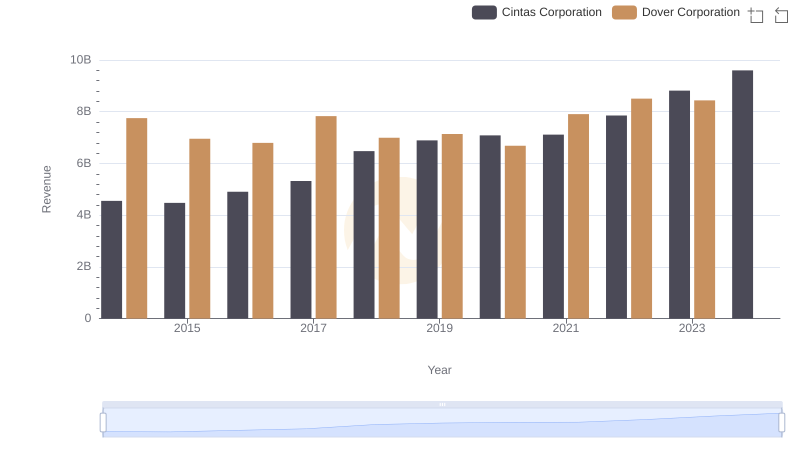
Revenue Insights: Cintas Corporation and Dover Corporation Performance Compared
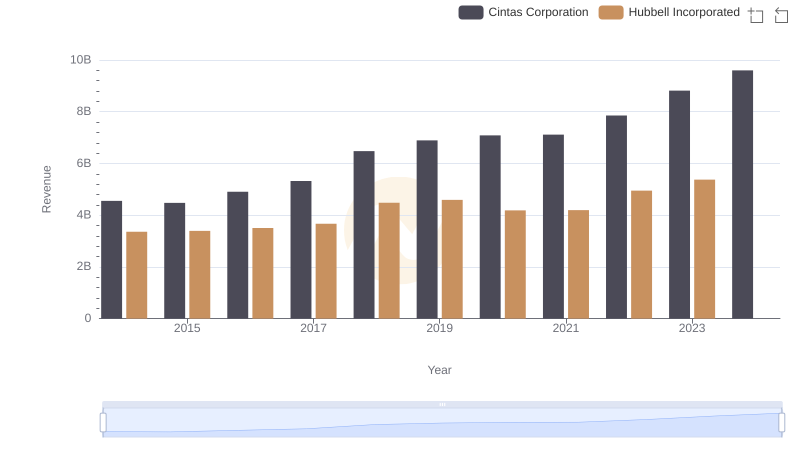
Comparing Revenue Performance: Cintas Corporation or Hubbell Incorporated?
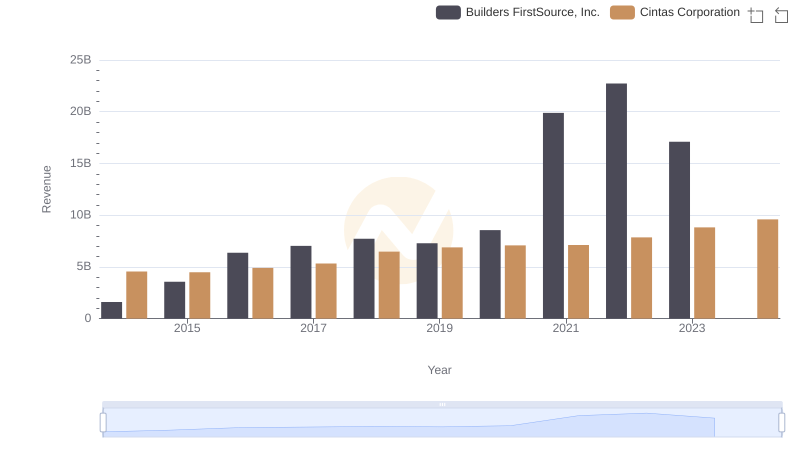
Cintas Corporation vs Builders FirstSource, Inc.: Annual Revenue Growth Compared
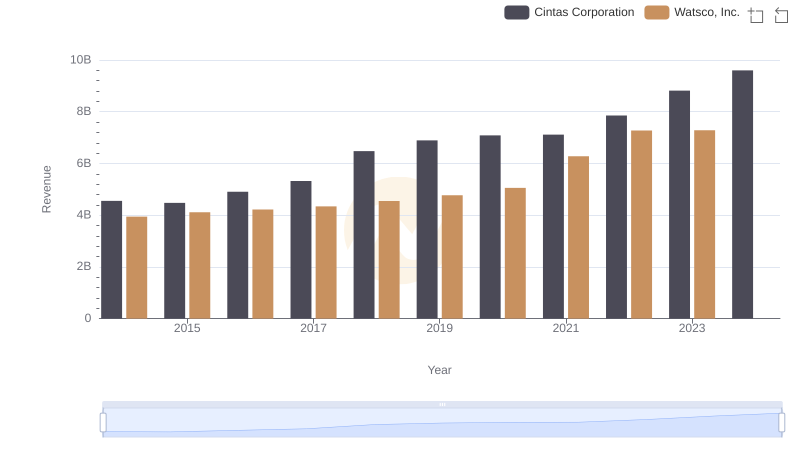
Cintas Corporation vs Watsco, Inc.: Examining Key Revenue Metrics
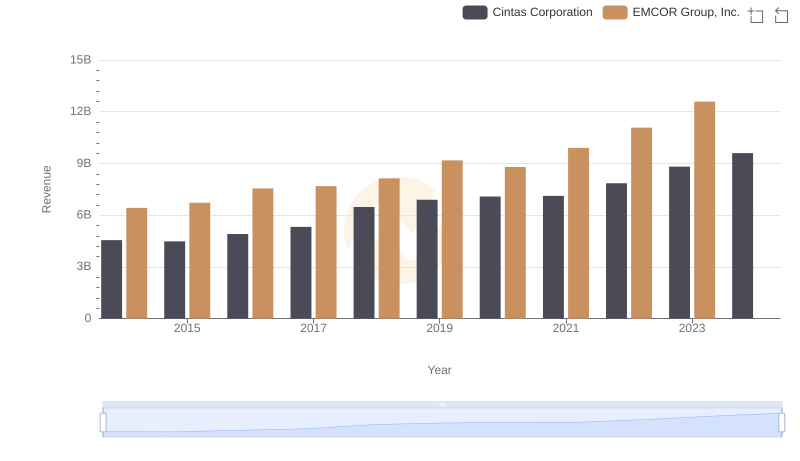
Cintas Corporation or EMCOR Group, Inc.: Who Leads in Yearly Revenue?
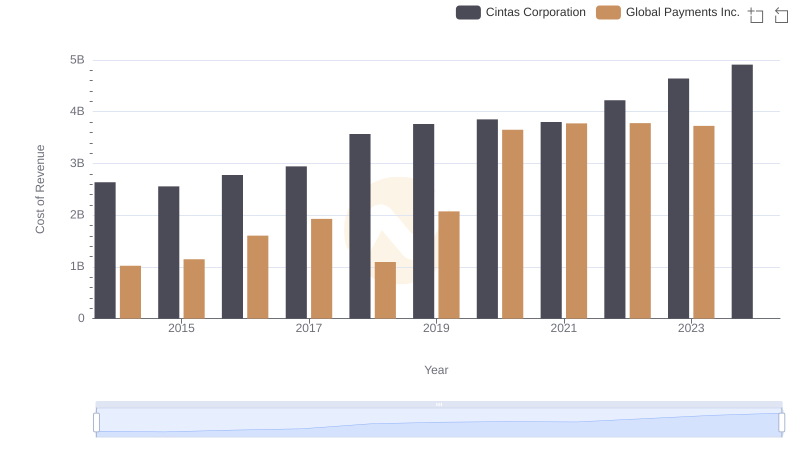
Comparing Cost of Revenue Efficiency: Cintas Corporation vs Global Payments Inc.
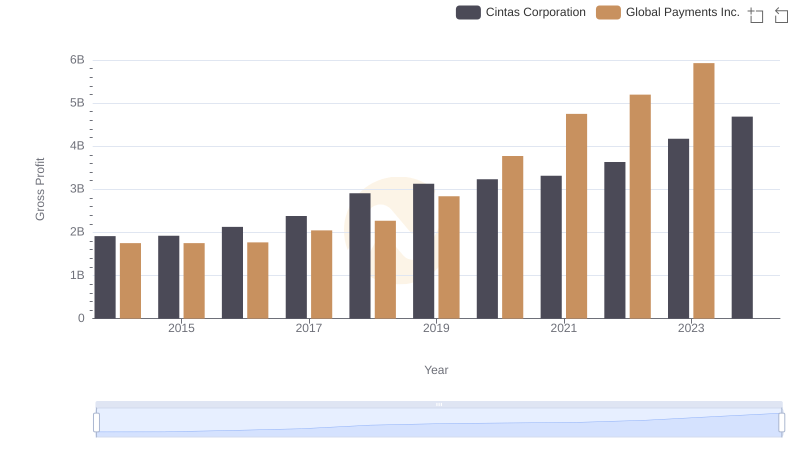
Who Generates Higher Gross Profit? Cintas Corporation or Global Payments Inc.
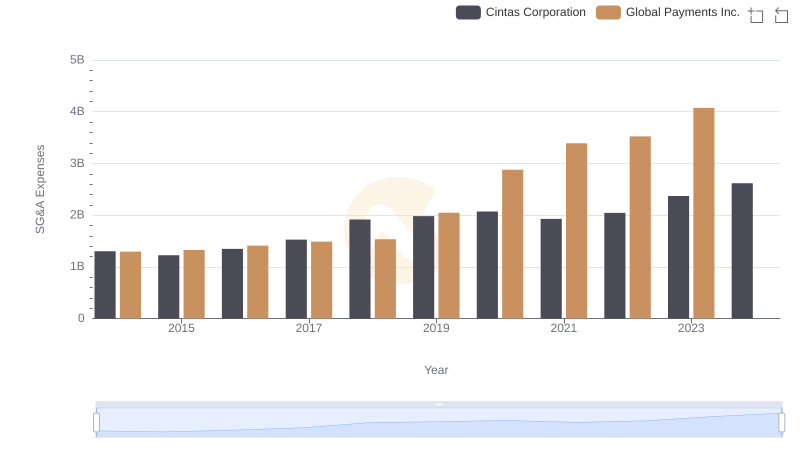
Cintas Corporation and Global Payments Inc.: SG&A Spending Patterns Compared