| __timestamp | Cintas Corporation | Global Payments Inc. |
|---|---|---|
| Wednesday, January 1, 2014 | 2637426000 | 1022107000 |
| Thursday, January 1, 2015 | 2555549000 | 1147639000 |
| Friday, January 1, 2016 | 2775588000 | 1603532000 |
| Sunday, January 1, 2017 | 2943086000 | 1928037000 |
| Monday, January 1, 2018 | 3568109000 | 1095014000 |
| Tuesday, January 1, 2019 | 3763715000 | 2073803000 |
| Wednesday, January 1, 2020 | 3851372000 | 3650727000 |
| Friday, January 1, 2021 | 3801689000 | 3773725000 |
| Saturday, January 1, 2022 | 4222213000 | 3778617000 |
| Sunday, January 1, 2023 | 4642401000 | 3727521000 |
| Monday, January 1, 2024 | 4910199000 | 3760116000 |
Infusing magic into the data realm
In the ever-evolving landscape of corporate finance, understanding cost efficiency is paramount. Cintas Corporation and Global Payments Inc. have been pivotal players in their respective industries. From 2014 to 2023, Cintas Corporation demonstrated a robust growth trajectory, with its cost of revenue increasing by approximately 86%, from $2.64 billion to $4.64 billion. This reflects a consistent upward trend, highlighting their strategic cost management. In contrast, Global Payments Inc. saw a more volatile pattern, peaking in 2022 with a cost of revenue of $3.78 billion, a 270% increase from 2014. However, data for 2024 is missing, leaving room for speculation on future trends. This comparison underscores the diverse strategies employed by these corporations in managing their operational costs, offering valuable insights for investors and industry analysts alike.
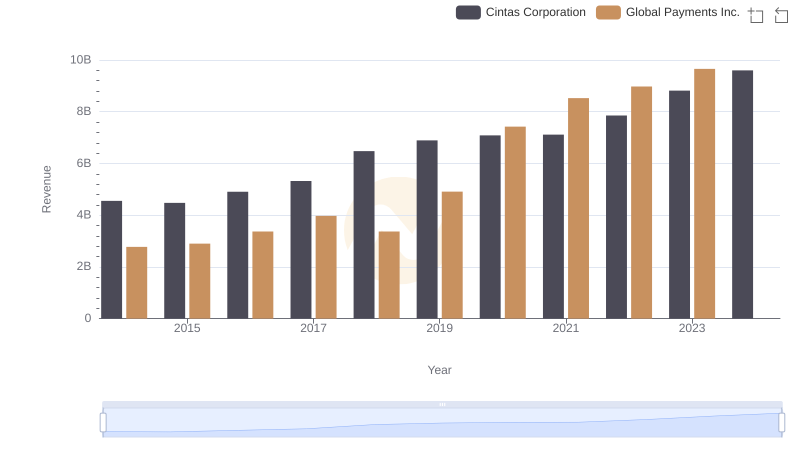
Comparing Revenue Performance: Cintas Corporation or Global Payments Inc.?
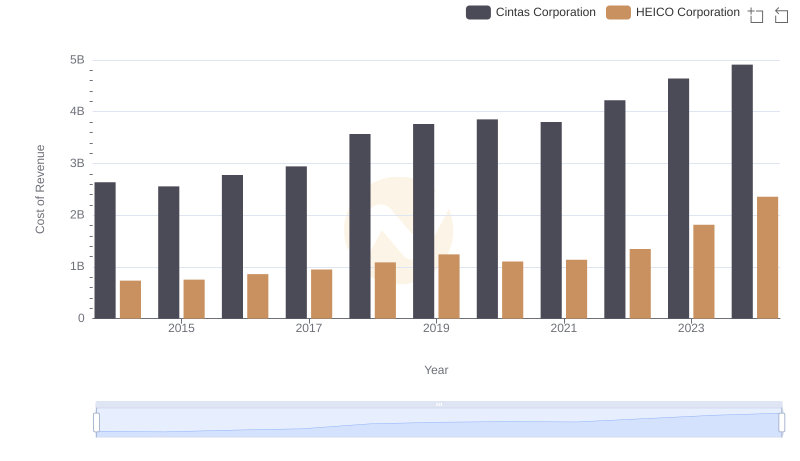
Cintas Corporation vs HEICO Corporation: Efficiency in Cost of Revenue Explored
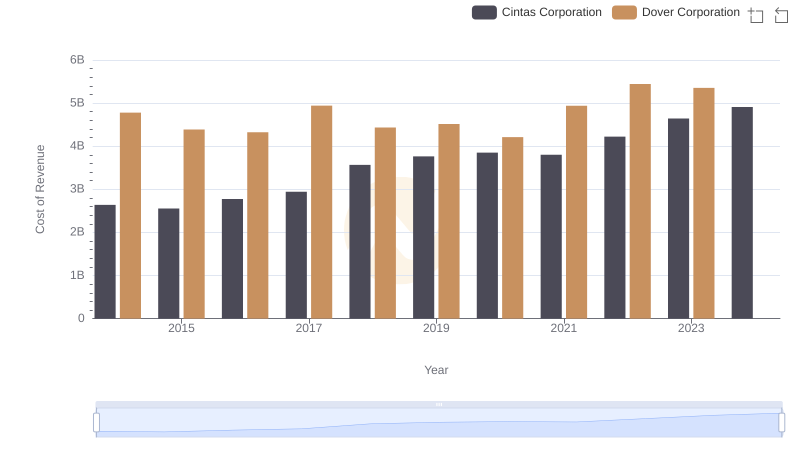
Cost of Revenue Trends: Cintas Corporation vs Dover Corporation
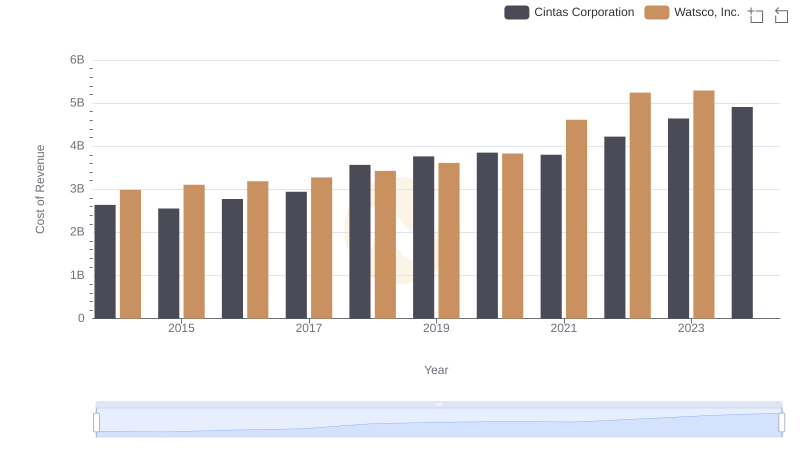
Cost of Revenue: Key Insights for Cintas Corporation and Watsco, Inc.
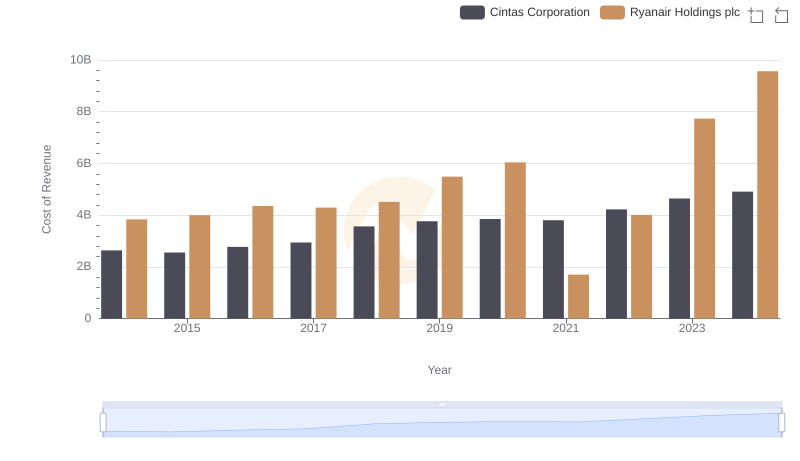
Cost Insights: Breaking Down Cintas Corporation and Ryanair Holdings plc's Expenses
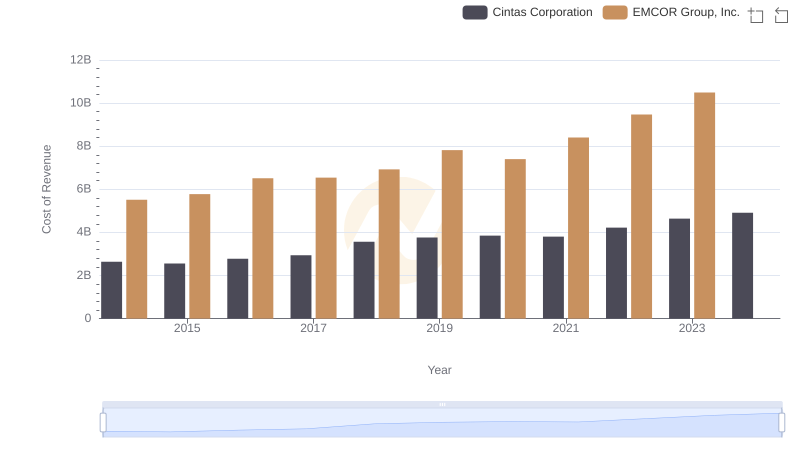
Comparing Cost of Revenue Efficiency: Cintas Corporation vs EMCOR Group, Inc.
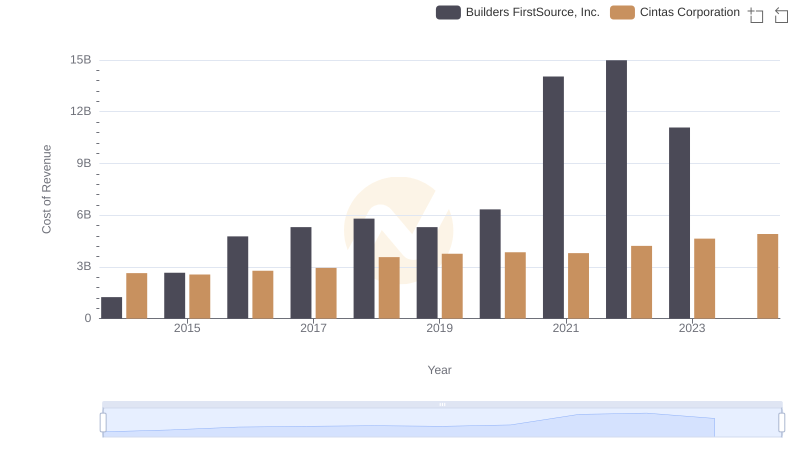
Comparing Cost of Revenue Efficiency: Cintas Corporation vs Builders FirstSource, Inc.
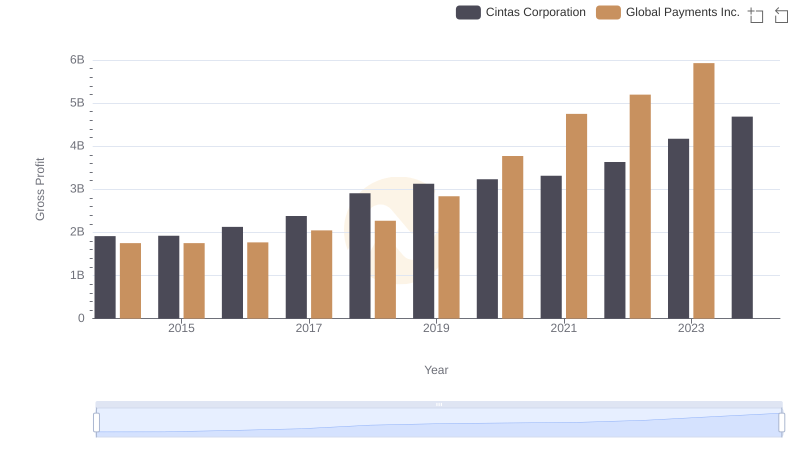
Who Generates Higher Gross Profit? Cintas Corporation or Global Payments Inc.
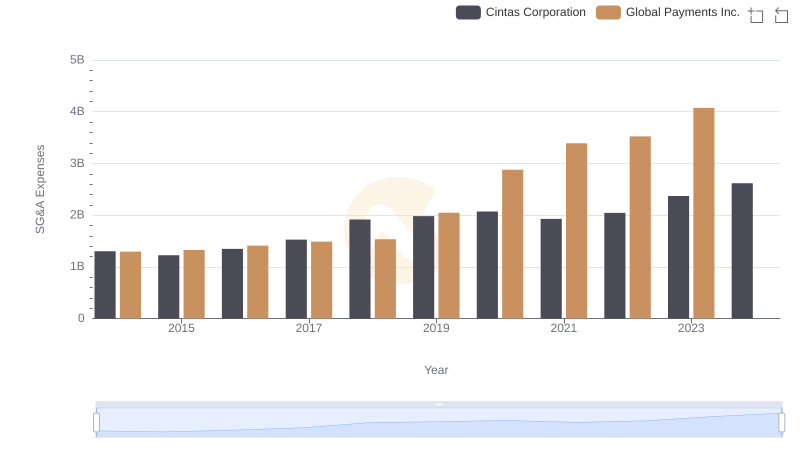
Cintas Corporation and Global Payments Inc.: SG&A Spending Patterns Compared