| __timestamp | J.B. Hunt Transport Services, Inc. | Lennox International Inc. |
|---|---|---|
| Wednesday, January 1, 2014 | 152469000 | 573700000 |
| Thursday, January 1, 2015 | 166799000 | 580500000 |
| Friday, January 1, 2016 | 185436000 | 621000000 |
| Sunday, January 1, 2017 | 273440000 | 637700000 |
| Monday, January 1, 2018 | 323587000 | 608200000 |
| Tuesday, January 1, 2019 | 383981000 | 585900000 |
| Wednesday, January 1, 2020 | 348076000 | 555900000 |
| Friday, January 1, 2021 | 395533000 | 598900000 |
| Saturday, January 1, 2022 | 570191000 | 627200000 |
| Sunday, January 1, 2023 | 590242000 | 705500000 |
| Monday, January 1, 2024 | 730600000 |
Unleashing the power of data
In the competitive landscape of corporate America, understanding the efficiency of Selling, General, and Administrative (SG&A) expenses is crucial. Over the past decade, Lennox International Inc. and J.B. Hunt Transport Services, Inc. have showcased contrasting trends in their SG&A expenditures.
From 2014 to 2023, Lennox International Inc. consistently maintained higher SG&A expenses, peaking at approximately $730 million in 2024. This represents a steady increase of around 27% from 2014. In contrast, J.B. Hunt Transport Services, Inc. saw a more volatile trajectory, with a significant rise of nearly 287% from 2014 to 2023, reaching about $590 million.
These trends highlight the strategic differences in managing operational costs. While Lennox shows a stable approach, J.B. Hunt's fluctuations suggest adaptive strategies in response to market dynamics. Understanding these patterns can offer valuable insights into corporate efficiency and strategic planning.
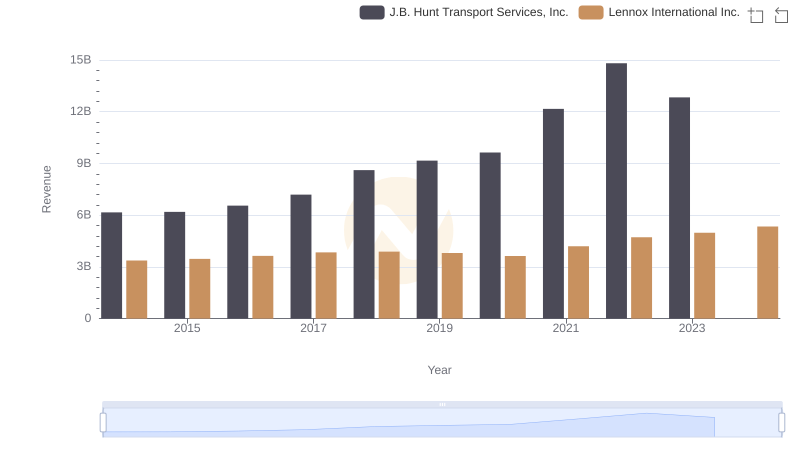
Lennox International Inc. or J.B. Hunt Transport Services, Inc.: Who Leads in Yearly Revenue?
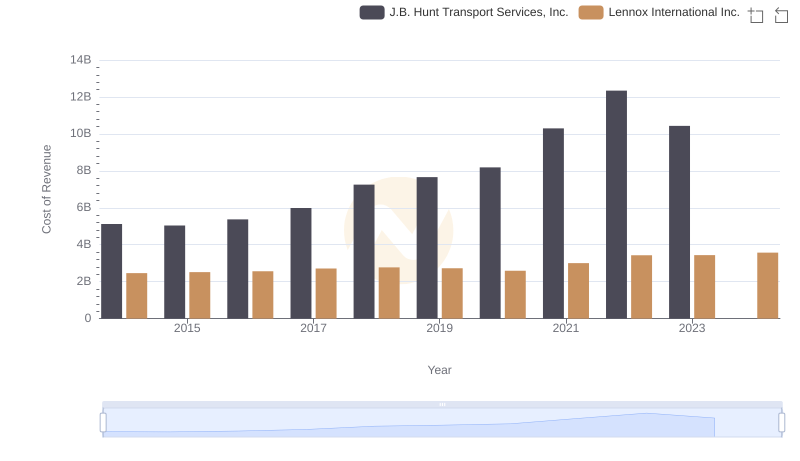
Comparing Cost of Revenue Efficiency: Lennox International Inc. vs J.B. Hunt Transport Services, Inc.
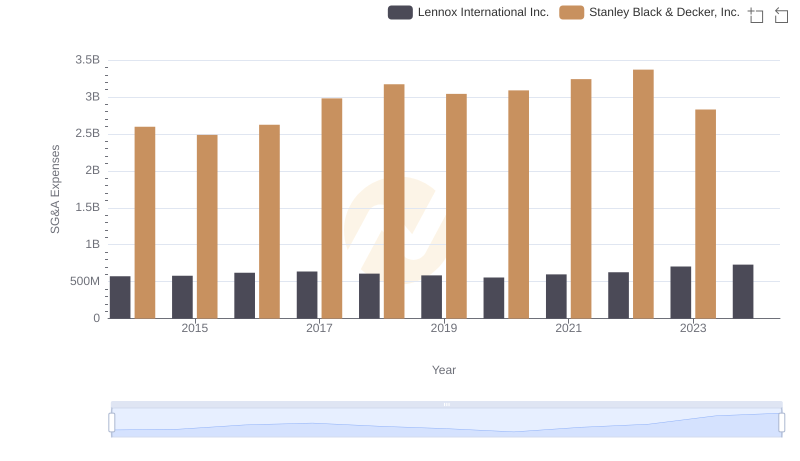
Who Optimizes SG&A Costs Better? Lennox International Inc. or Stanley Black & Decker, Inc.
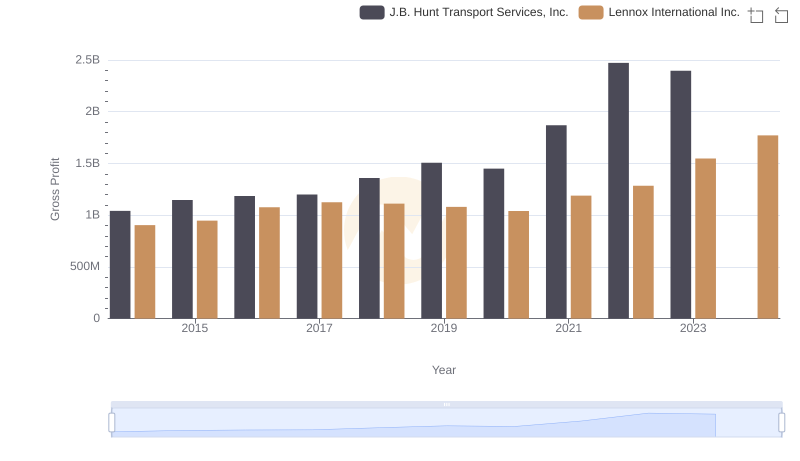
Lennox International Inc. and J.B. Hunt Transport Services, Inc.: A Detailed Gross Profit Analysis
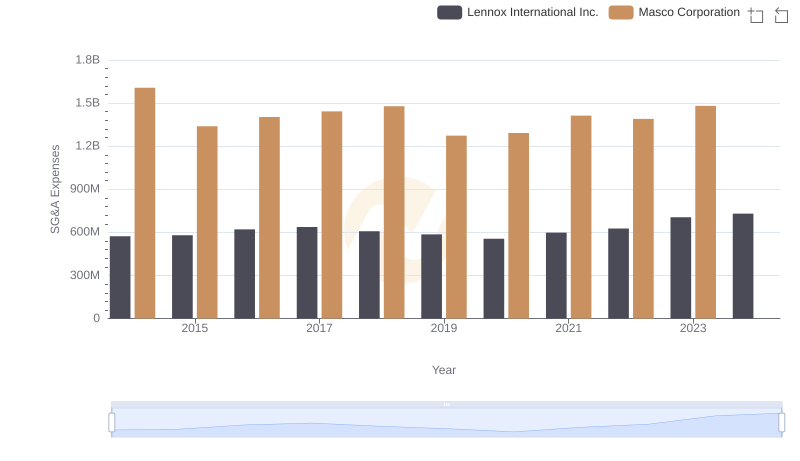
Lennox International Inc. or Masco Corporation: Who Manages SG&A Costs Better?
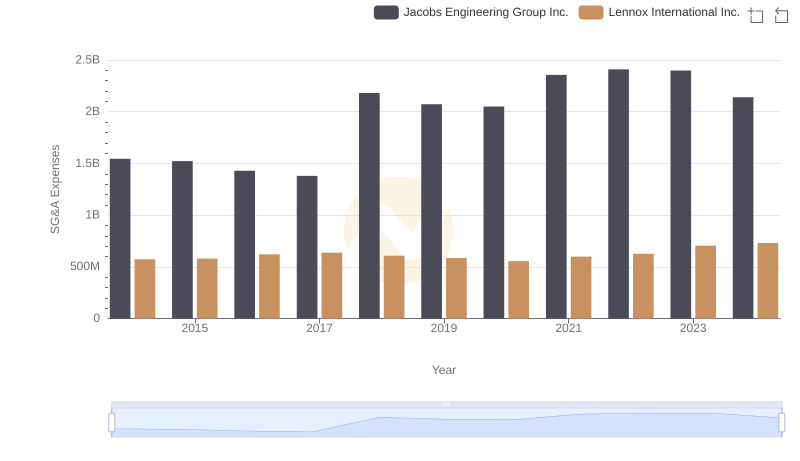
SG&A Efficiency Analysis: Comparing Lennox International Inc. and Jacobs Engineering Group Inc.
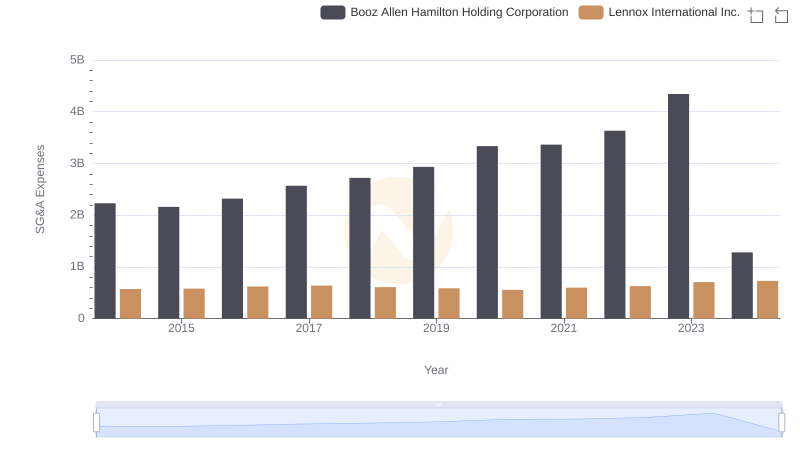
Selling, General, and Administrative Costs: Lennox International Inc. vs Booz Allen Hamilton Holding Corporation
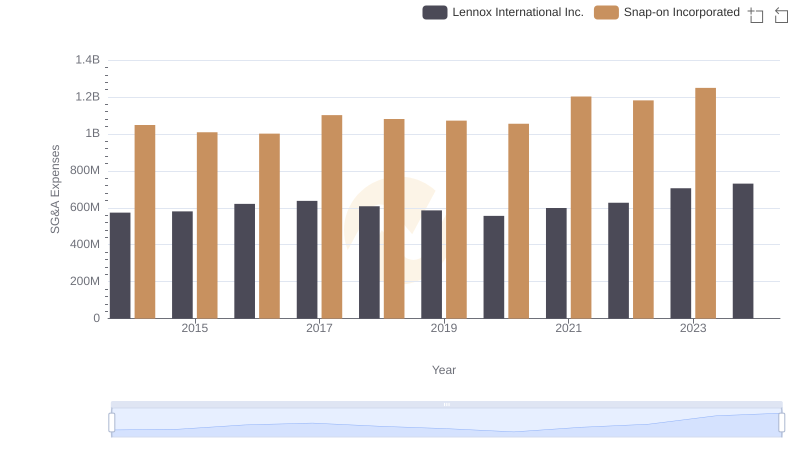
Breaking Down SG&A Expenses: Lennox International Inc. vs Snap-on Incorporated
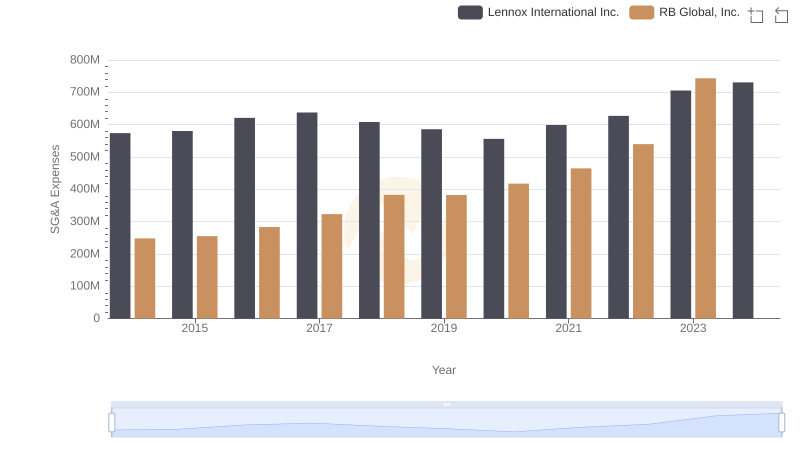
Operational Costs Compared: SG&A Analysis of Lennox International Inc. and RB Global, Inc.
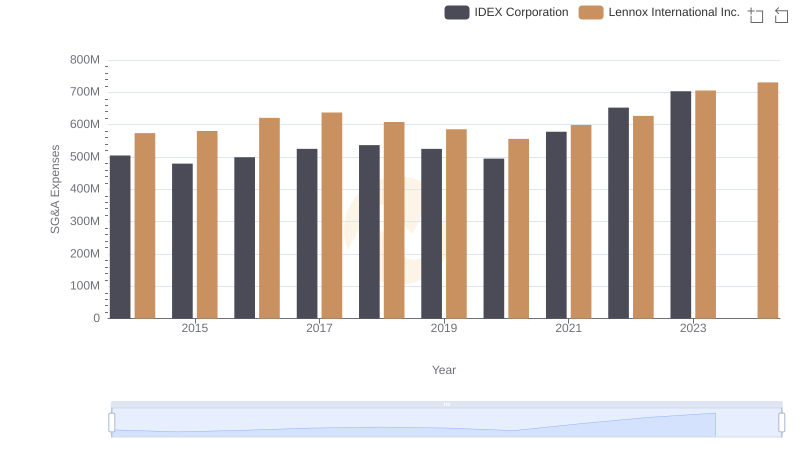
Lennox International Inc. vs IDEX Corporation: SG&A Expense Trends
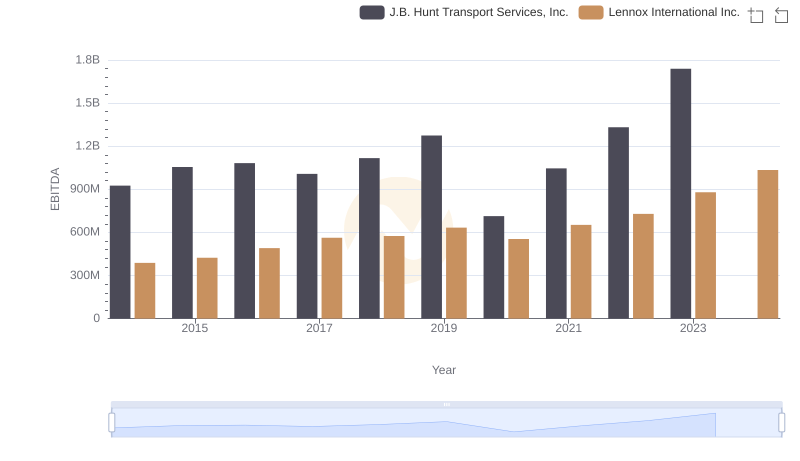
EBITDA Metrics Evaluated: Lennox International Inc. vs J.B. Hunt Transport Services, Inc.
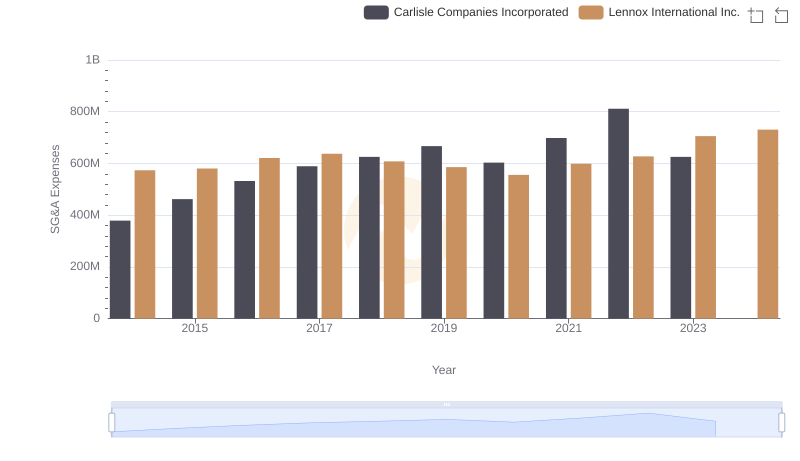
Selling, General, and Administrative Costs: Lennox International Inc. vs Carlisle Companies Incorporated