| __timestamp | Intuit Inc. | Wipro Limited |
|---|---|---|
| Wednesday, January 1, 2014 | 668000000 | 321284000000 |
| Thursday, January 1, 2015 | 725000000 | 356724000000 |
| Friday, January 1, 2016 | 752000000 | 391544000000 |
| Sunday, January 1, 2017 | 809000000 | 385575000000 |
| Monday, January 1, 2018 | 977000000 | 413033000000 |
| Tuesday, January 1, 2019 | 1167000000 | 436085000000 |
| Wednesday, January 1, 2020 | 1378000000 | 423205000000 |
| Friday, January 1, 2021 | 1683000000 | 555872000000 |
| Saturday, January 1, 2022 | 2406000000 | 645446000000 |
| Sunday, January 1, 2023 | 3143000000 | 631497000000 |
| Monday, January 1, 2024 | 3465000000 | 631497000000 |
Data in motion
In the ever-evolving landscape of global business, understanding the cost of revenue is crucial for evaluating a company's financial health. This analysis delves into the cost of revenue trends for Intuit Inc. and Wipro Limited from 2014 to 2024. Over this decade, Intuit Inc. has seen a remarkable increase in its cost of revenue, growing by over 400%, from approximately $668 million in 2014 to $3.465 billion in 2024. This surge reflects Intuit's expanding operations and investment in product development.
Conversely, Wipro Limited, a giant in the IT services sector, has maintained a relatively stable cost of revenue, with a modest increase of around 96% over the same period. This stability underscores Wipro's efficient cost management strategies amidst its global expansion. The data highlights the contrasting growth trajectories and strategic priorities of these two industry leaders.
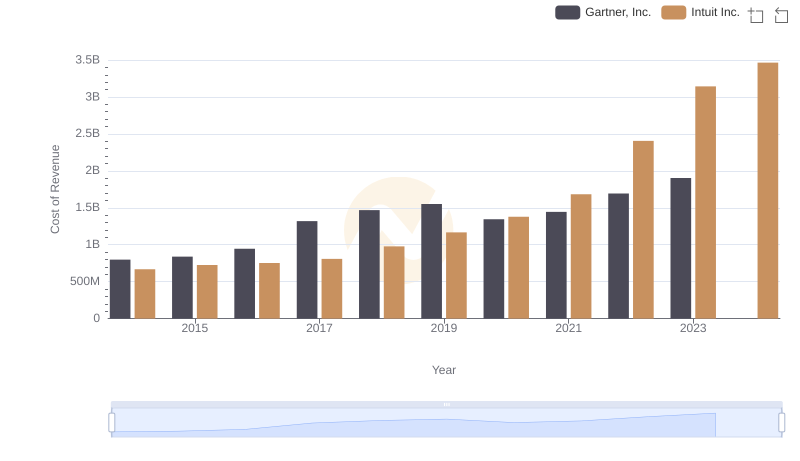
Intuit Inc. vs Gartner, Inc.: Efficiency in Cost of Revenue Explored
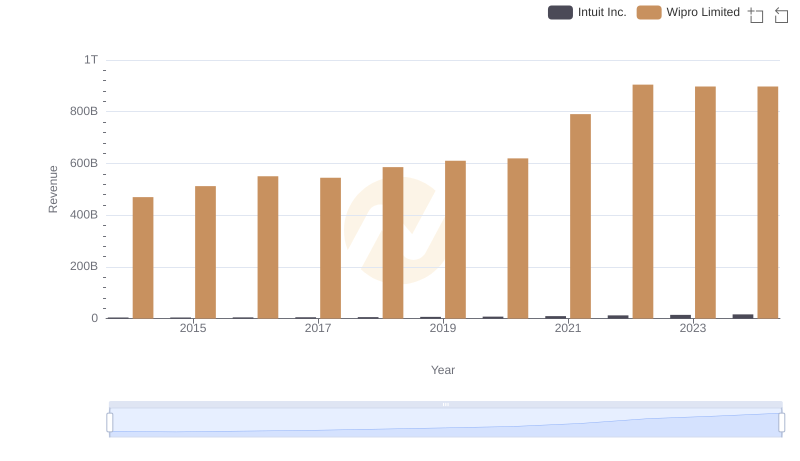
Intuit Inc. or Wipro Limited: Who Leads in Yearly Revenue?
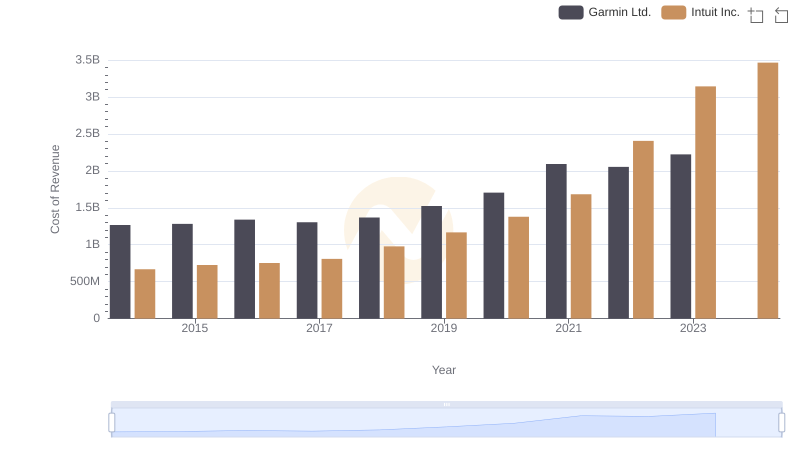
Cost of Revenue Comparison: Intuit Inc. vs Garmin Ltd.
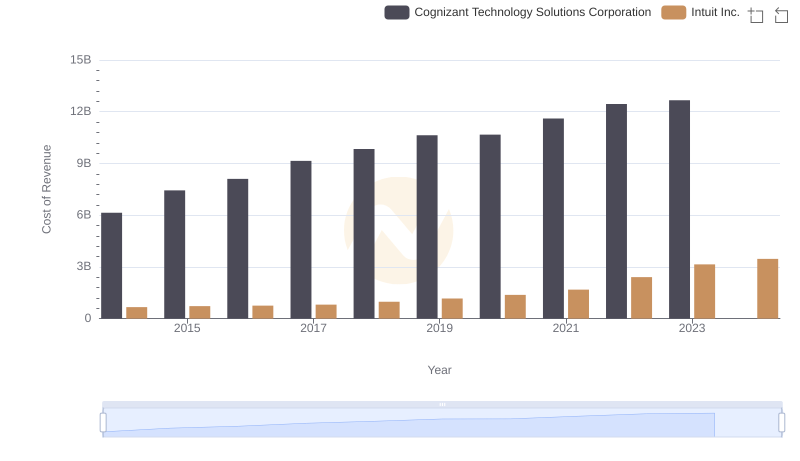
Cost Insights: Breaking Down Intuit Inc. and Cognizant Technology Solutions Corporation's Expenses
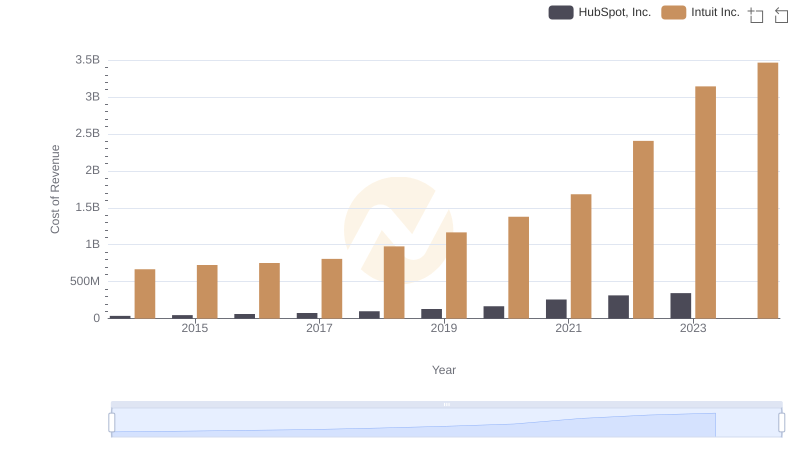
Comparing Cost of Revenue Efficiency: Intuit Inc. vs HubSpot, Inc.

Cost of Revenue: Key Insights for Intuit Inc. and Take-Two Interactive Software, Inc.
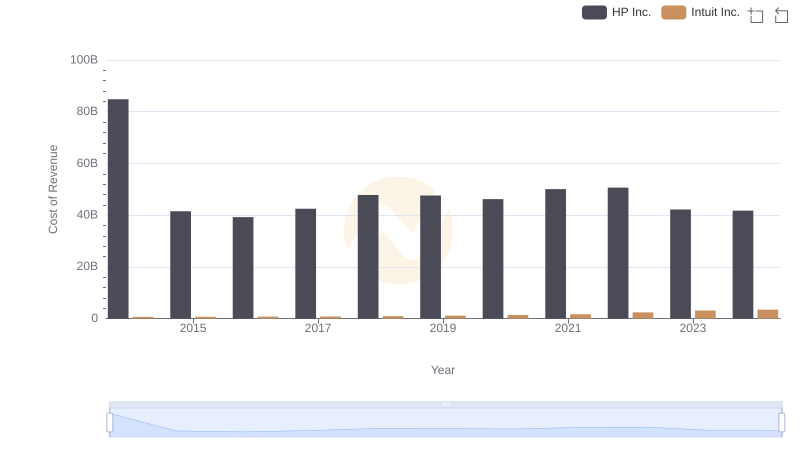
Cost of Revenue Trends: Intuit Inc. vs HP Inc.
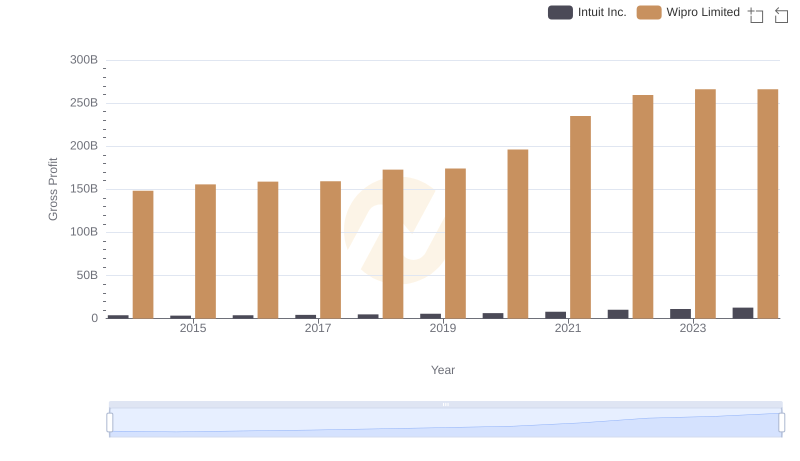
Gross Profit Trends Compared: Intuit Inc. vs Wipro Limited
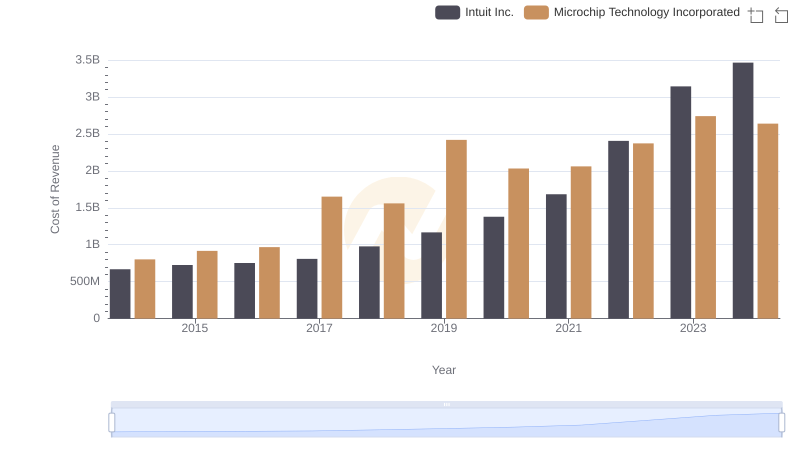
Cost of Revenue Trends: Intuit Inc. vs Microchip Technology Incorporated
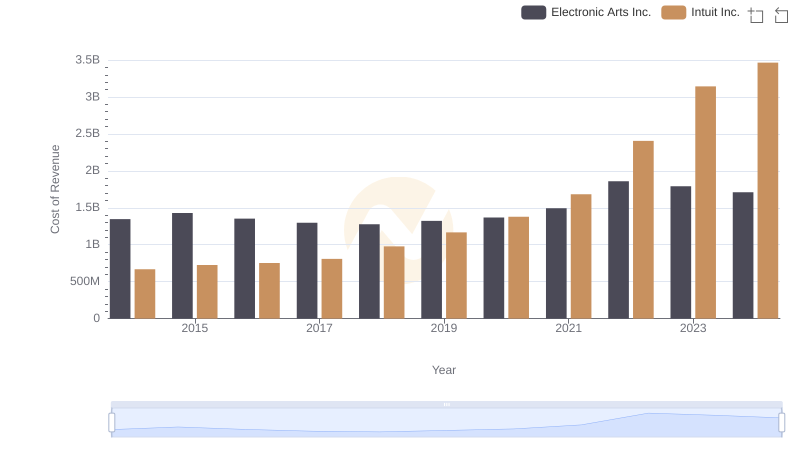
Cost Insights: Breaking Down Intuit Inc. and Electronic Arts Inc.'s Expenses
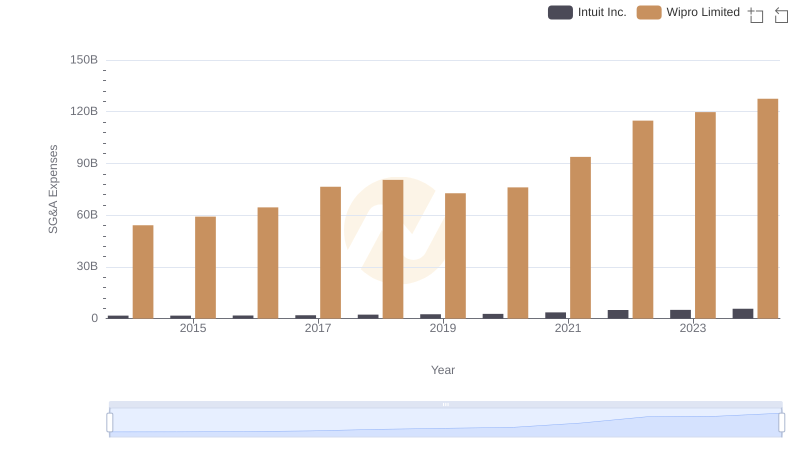
Breaking Down SG&A Expenses: Intuit Inc. vs Wipro Limited
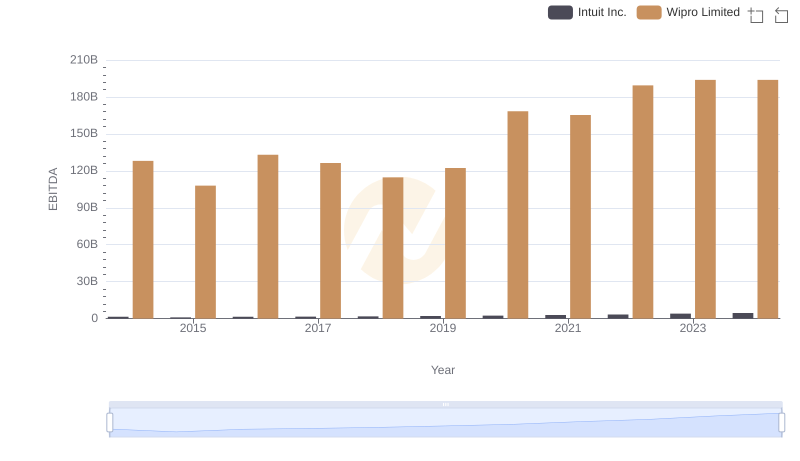
A Professional Review of EBITDA: Intuit Inc. Compared to Wipro Limited