| __timestamp | International Business Machines Corporation | Monolithic Power Systems, Inc. |
|---|---|---|
| Wednesday, January 1, 2014 | 22472000000 | 66755000 |
| Thursday, January 1, 2015 | 19894000000 | 72312000 |
| Friday, January 1, 2016 | 20279000000 | 83012000 |
| Sunday, January 1, 2017 | 19680000000 | 97257000 |
| Monday, January 1, 2018 | 19366000000 | 113803000 |
| Tuesday, January 1, 2019 | 18724000000 | 133542000 |
| Wednesday, January 1, 2020 | 20561000000 | 161670000 |
| Friday, January 1, 2021 | 18745000000 | 226190000 |
| Saturday, January 1, 2022 | 17483000000 | 273595000 |
| Sunday, January 1, 2023 | 17997000000 | 275740000 |
| Monday, January 1, 2024 | 29536000000 |
Unveiling the hidden dimensions of data
In the ever-evolving landscape of technology, understanding a company's operational efficiency is crucial. This analysis delves into the Selling, General, and Administrative (SG&A) expenses of two industry titans: International Business Machines Corporation (IBM) and Monolithic Power Systems, Inc. (MPWR).
From 2014 to 2023, IBM's SG&A expenses have shown a fluctuating trend, peaking in 2024 with a 30% increase from the previous year. In contrast, MPWR's expenses have steadily risen, reflecting its growth trajectory in the semiconductor industry. Notably, MPWR's expenses surged by over 300% from 2014 to 2023, highlighting its aggressive expansion strategy.
While IBM's data extends into 2024, MPWR's figures for the same year remain elusive, leaving room for speculation on its future financial strategies. This comparison underscores the diverse approaches these companies take in managing their operational costs.
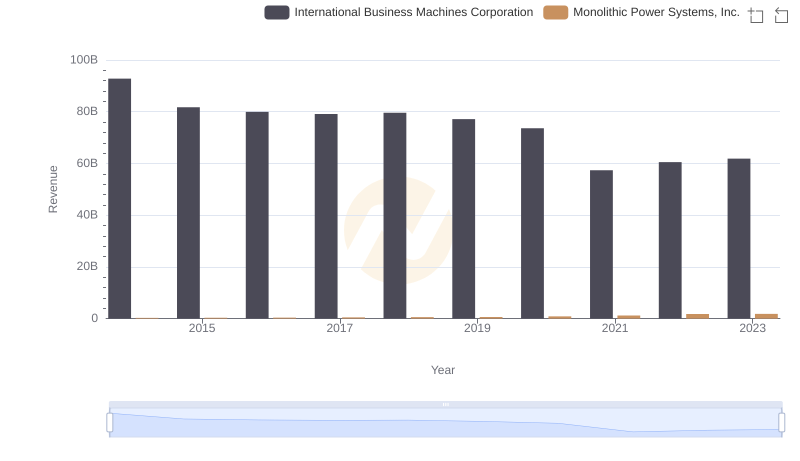
International Business Machines Corporation vs Monolithic Power Systems, Inc.: Examining Key Revenue Metrics
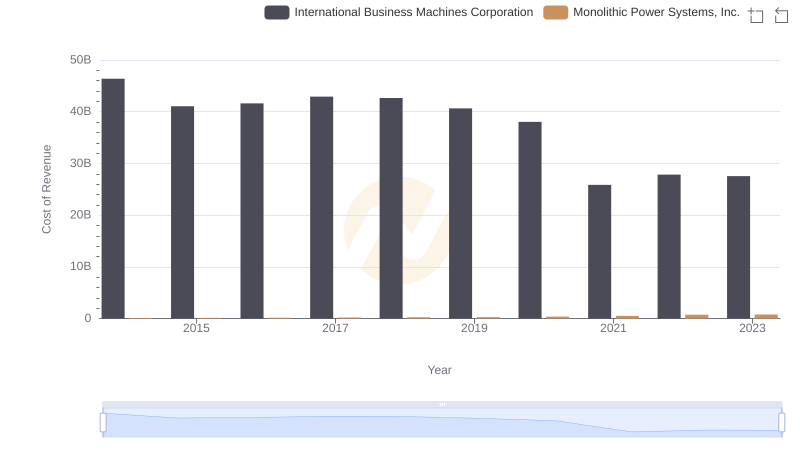
Cost of Revenue Comparison: International Business Machines Corporation vs Monolithic Power Systems, Inc.
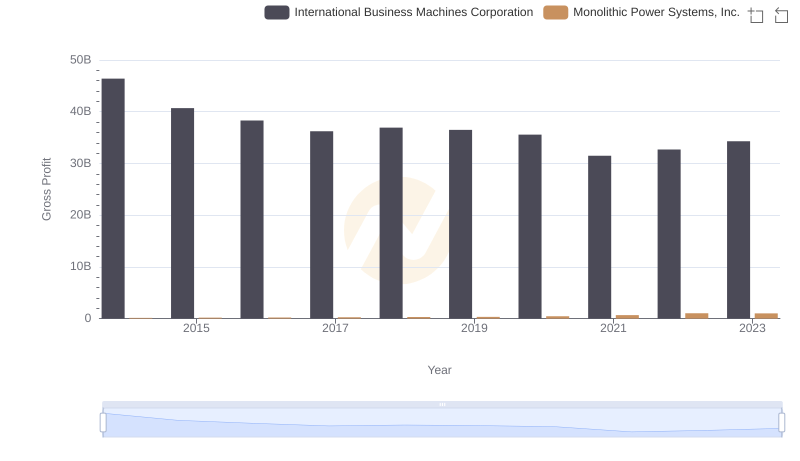
Key Insights on Gross Profit: International Business Machines Corporation vs Monolithic Power Systems, Inc.
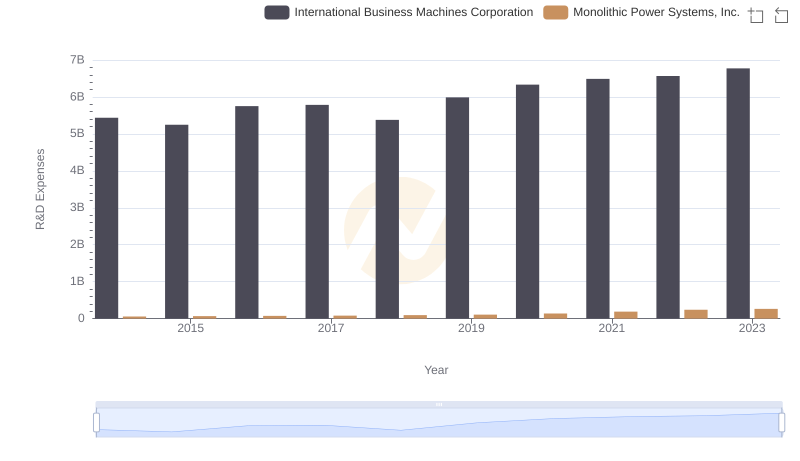
Research and Development: Comparing Key Metrics for International Business Machines Corporation and Monolithic Power Systems, Inc.
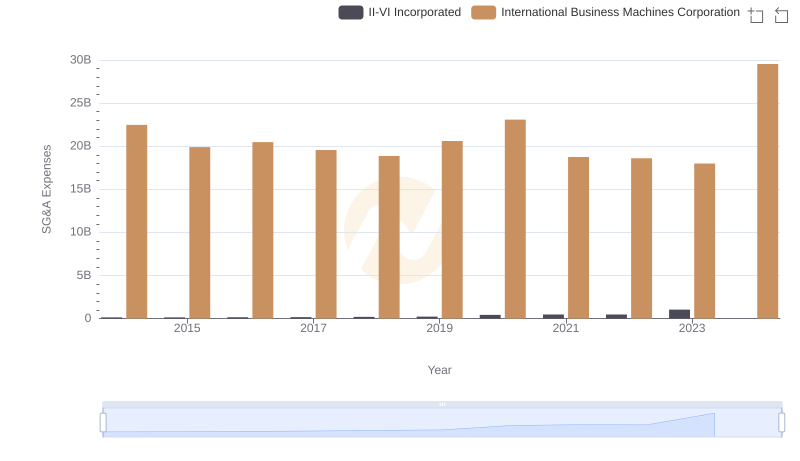
SG&A Efficiency Analysis: Comparing International Business Machines Corporation and II-VI Incorporated
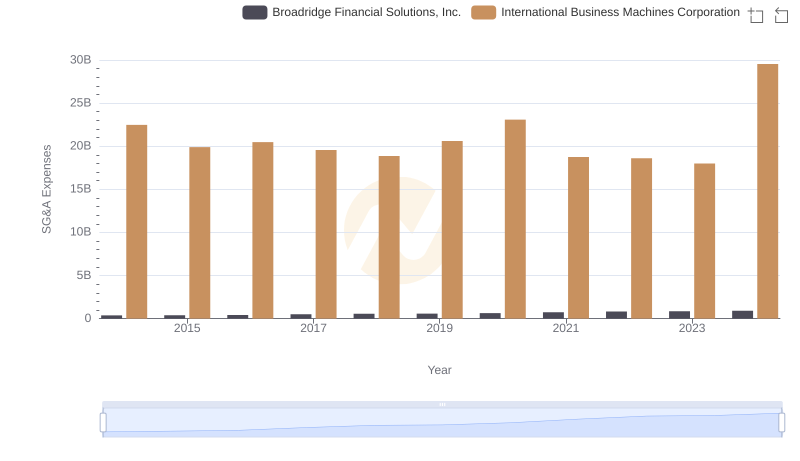
Operational Costs Compared: SG&A Analysis of International Business Machines Corporation and Broadridge Financial Solutions, Inc.
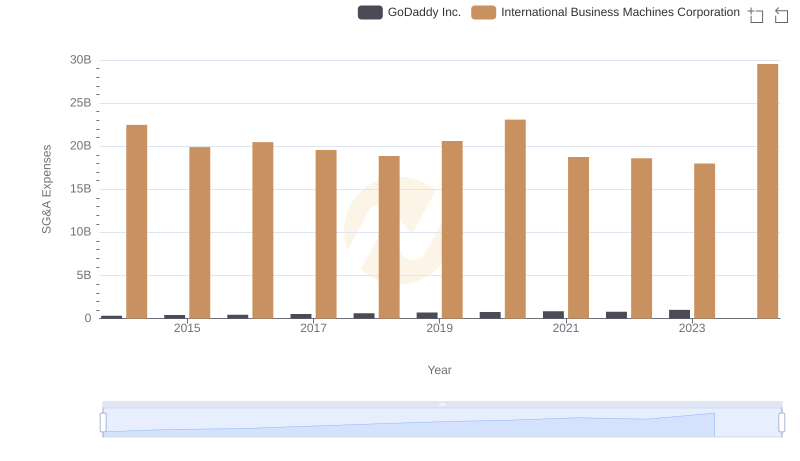
Cost Management Insights: SG&A Expenses for International Business Machines Corporation and GoDaddy Inc.
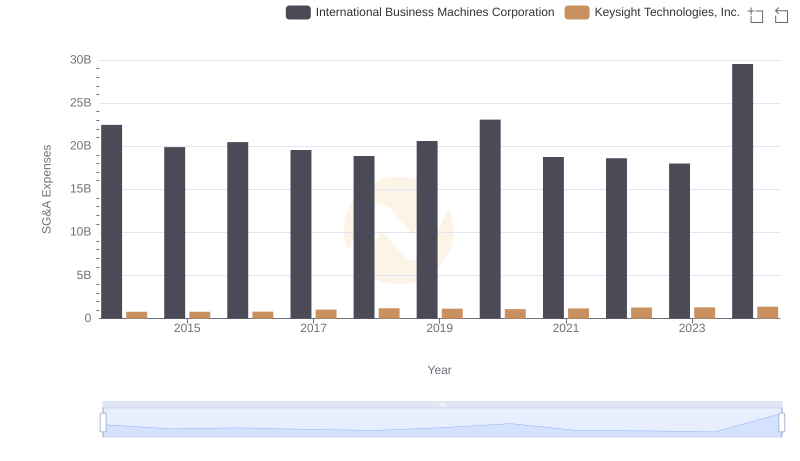
Cost Management Insights: SG&A Expenses for International Business Machines Corporation and Keysight Technologies, Inc.
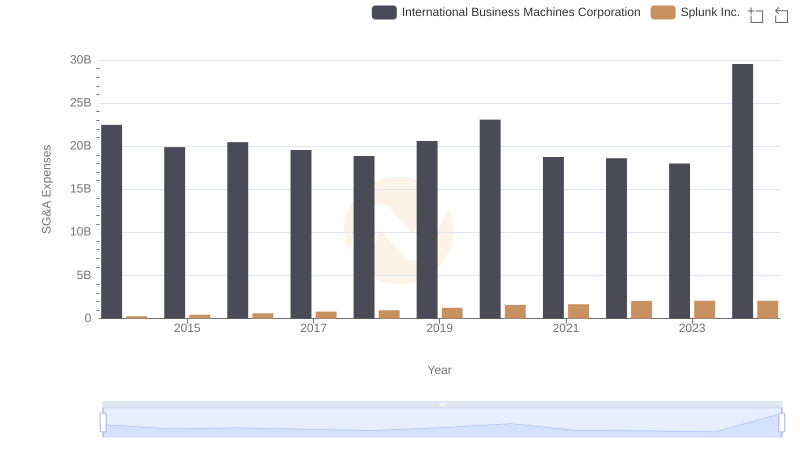
Selling, General, and Administrative Costs: International Business Machines Corporation vs Splunk Inc.

Breaking Down SG&A Expenses: International Business Machines Corporation vs Corpay, Inc.
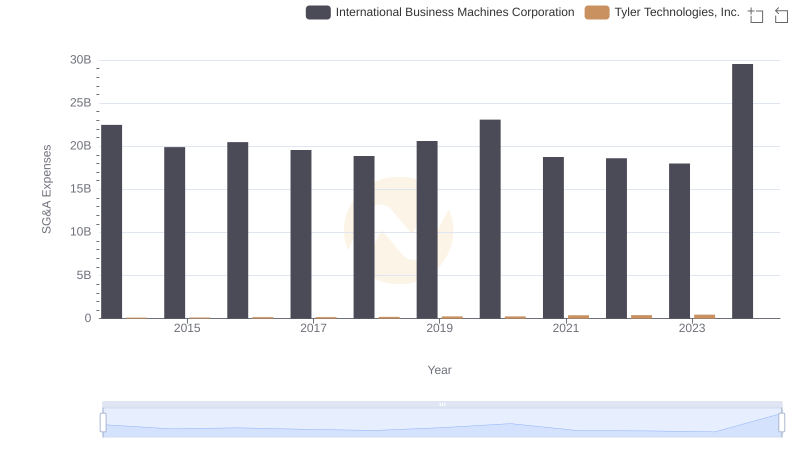
Comparing SG&A Expenses: International Business Machines Corporation vs Tyler Technologies, Inc. Trends and Insights
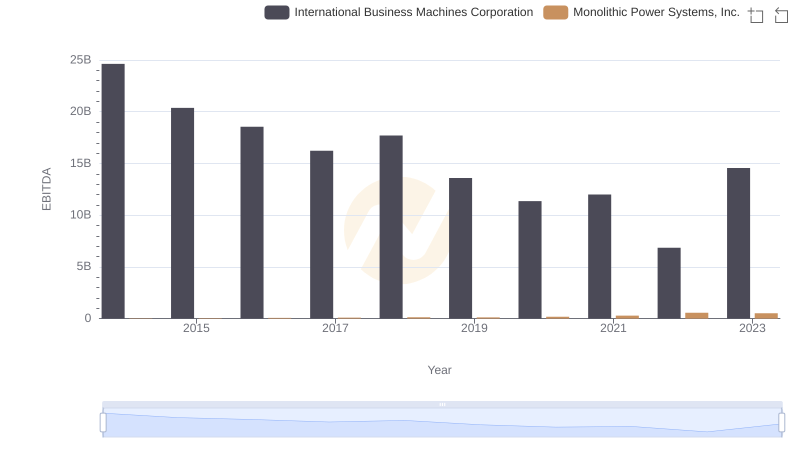
EBITDA Performance Review: International Business Machines Corporation vs Monolithic Power Systems, Inc.