| __timestamp | International Business Machines Corporation | Splunk Inc. |
|---|---|---|
| Wednesday, January 1, 2014 | 22472000000 | 269210000 |
| Thursday, January 1, 2015 | 19894000000 | 447517000 |
| Friday, January 1, 2016 | 20279000000 | 626927000 |
| Sunday, January 1, 2017 | 19680000000 | 806883000 |
| Monday, January 1, 2018 | 19366000000 | 967560000 |
| Tuesday, January 1, 2019 | 18724000000 | 1267538000 |
| Wednesday, January 1, 2020 | 20561000000 | 1596475000 |
| Friday, January 1, 2021 | 18745000000 | 1671200000 |
| Saturday, January 1, 2022 | 17483000000 | 2056950000 |
| Sunday, January 1, 2023 | 17997000000 | 2076049000 |
| Monday, January 1, 2024 | 29536000000 | 2074630000 |
Data in motion
In the ever-evolving landscape of technology, understanding the financial strategies of industry leaders is crucial. This analysis delves into the Selling, General, and Administrative (SG&A) expenses of two tech titans: International Business Machines Corporation (IBM) and Splunk Inc., from 2014 to 2024.
IBM, a stalwart in the tech industry, has consistently maintained high SG&A expenses, peaking at approximately $29.5 billion in 2024. Despite fluctuations, IBM's expenses have remained relatively stable, reflecting its expansive global operations and commitment to innovation.
Conversely, Splunk, a leader in data analytics, has seen its SG&A expenses grow by nearly 670% over the decade, reaching around $2.1 billion in 2023. This surge underscores Splunk's aggressive expansion and investment in market penetration.
This comparison highlights the contrasting strategies of a legacy giant and a rising star, offering insights into their financial priorities and market approaches.
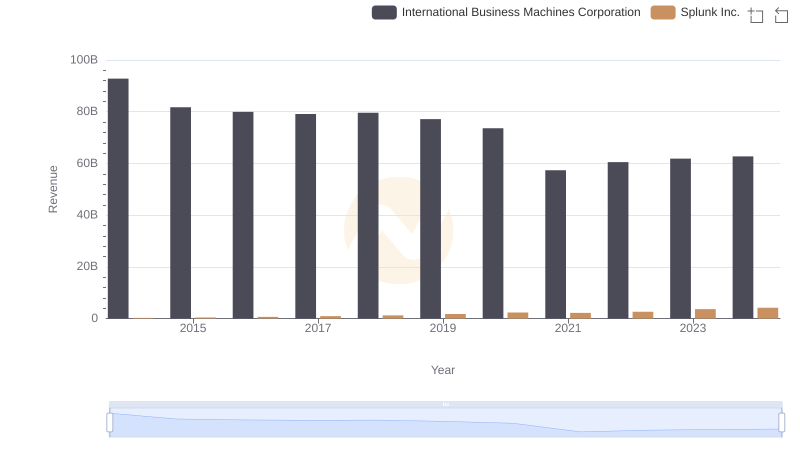
Comparing Revenue Performance: International Business Machines Corporation or Splunk Inc.?
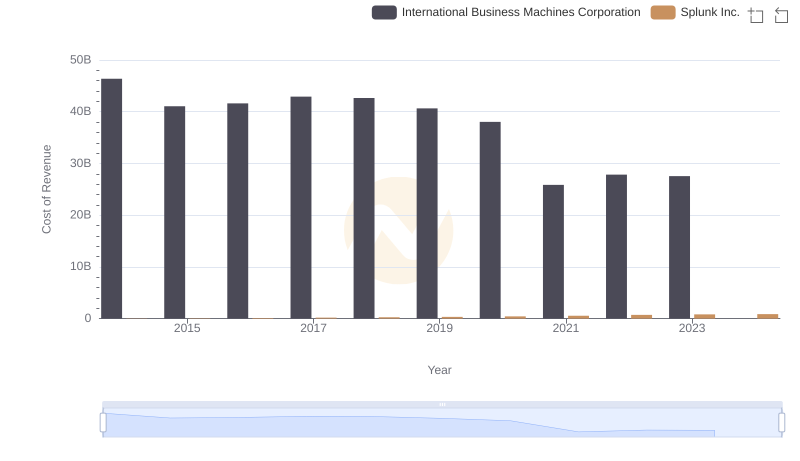
Cost of Revenue Comparison: International Business Machines Corporation vs Splunk Inc.
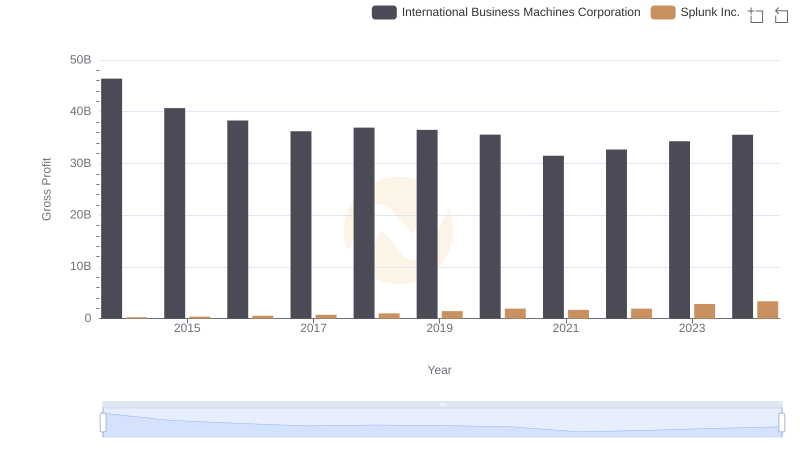
Gross Profit Trends Compared: International Business Machines Corporation vs Splunk Inc.
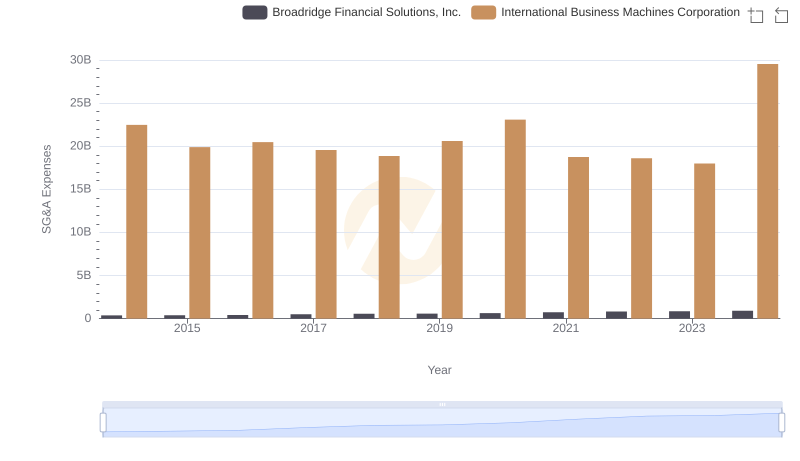
Operational Costs Compared: SG&A Analysis of International Business Machines Corporation and Broadridge Financial Solutions, Inc.
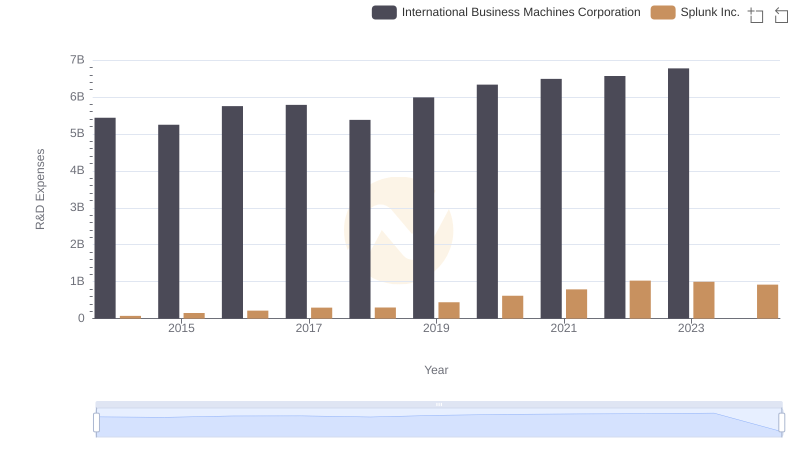
Comparing Innovation Spending: International Business Machines Corporation and Splunk Inc.
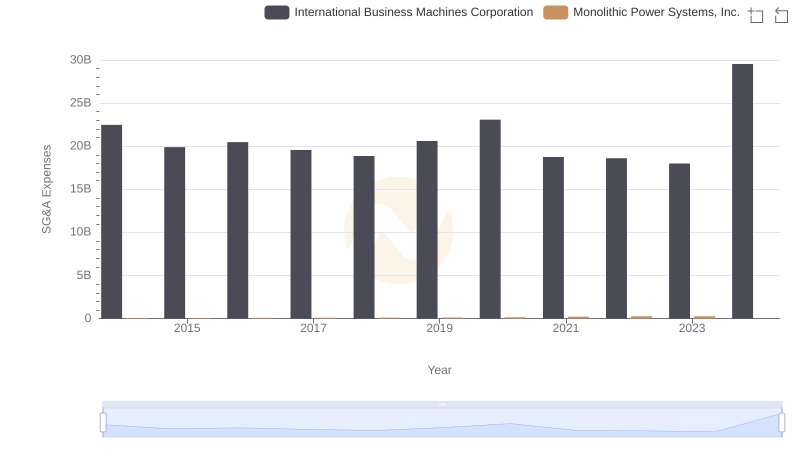
SG&A Efficiency Analysis: Comparing International Business Machines Corporation and Monolithic Power Systems, Inc.
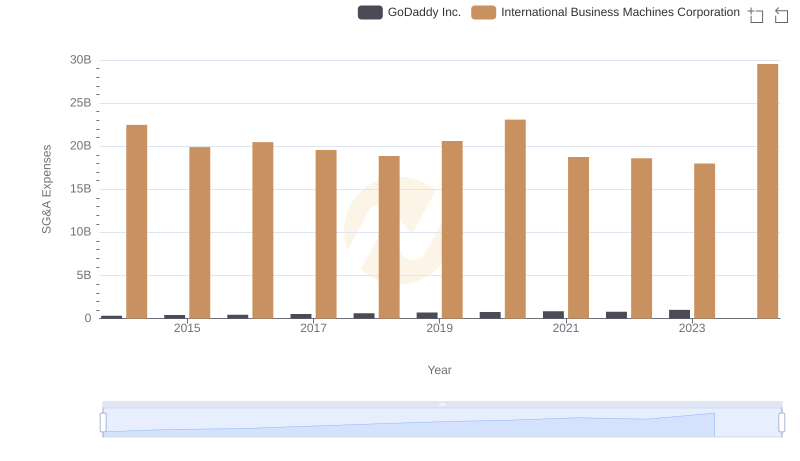
Cost Management Insights: SG&A Expenses for International Business Machines Corporation and GoDaddy Inc.
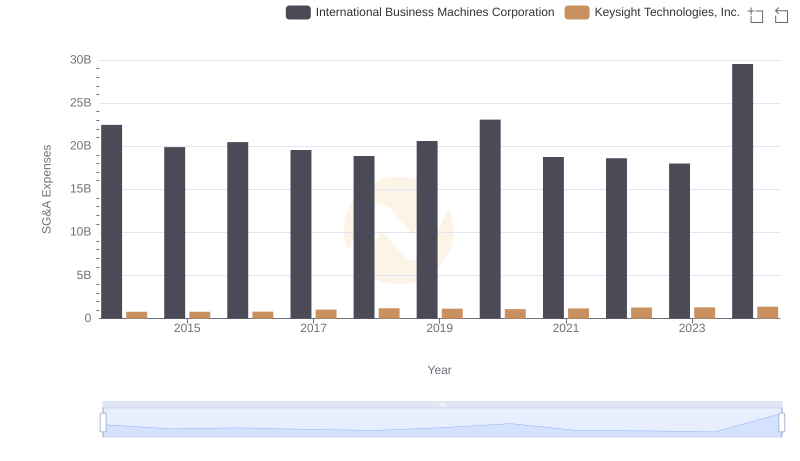
Cost Management Insights: SG&A Expenses for International Business Machines Corporation and Keysight Technologies, Inc.

Breaking Down SG&A Expenses: International Business Machines Corporation vs Corpay, Inc.
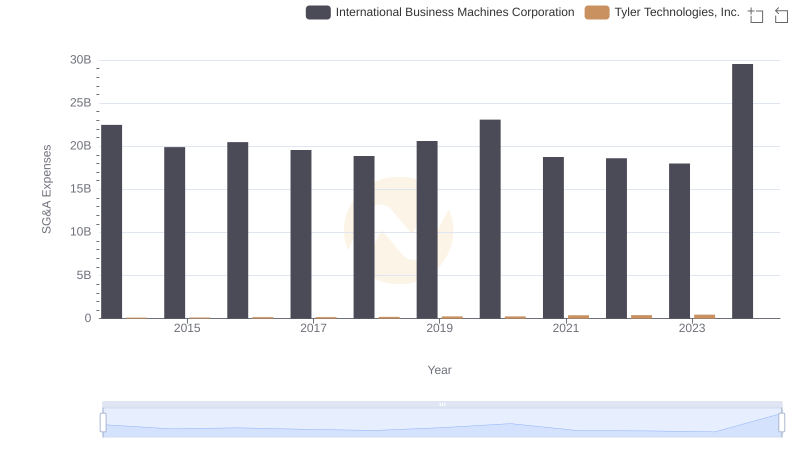
Comparing SG&A Expenses: International Business Machines Corporation vs Tyler Technologies, Inc. Trends and Insights
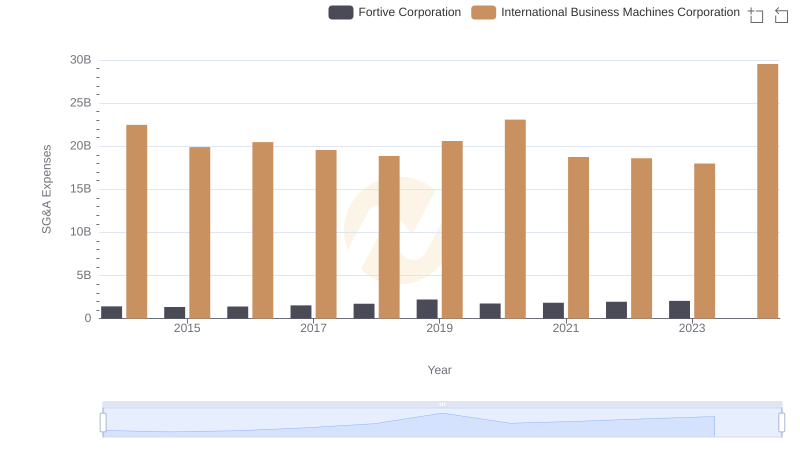
Who Optimizes SG&A Costs Better? International Business Machines Corporation or Fortive Corporation
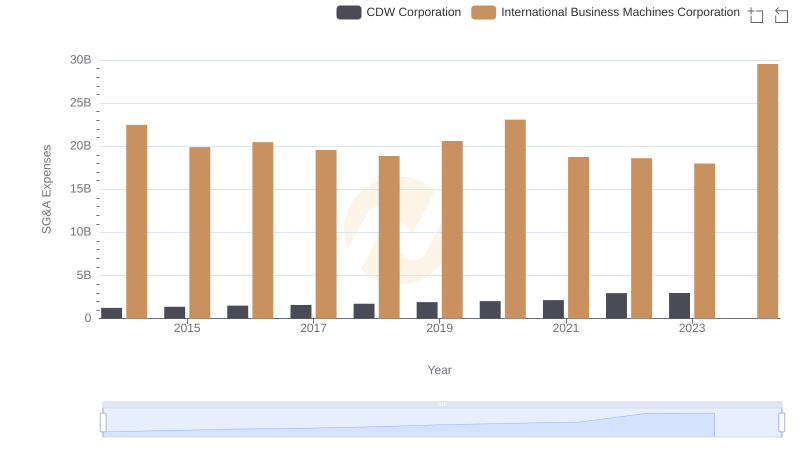
International Business Machines Corporation vs CDW Corporation: SG&A Expense Trends