| __timestamp | Paychex, Inc. | Union Pacific Corporation |
|---|---|---|
| Wednesday, January 1, 2014 | 2518900000 | 23988000000 |
| Thursday, January 1, 2015 | 2739600000 | 21813000000 |
| Friday, January 1, 2016 | 2951900000 | 19941000000 |
| Sunday, January 1, 2017 | 3151300000 | 21240000000 |
| Monday, January 1, 2018 | 3380900000 | 22832000000 |
| Tuesday, January 1, 2019 | 3772500000 | 21708000000 |
| Wednesday, January 1, 2020 | 4040500000 | 19533000000 |
| Friday, January 1, 2021 | 4056800000 | 21804000000 |
| Saturday, January 1, 2022 | 4611700000 | 24875000000 |
| Sunday, January 1, 2023 | 5007100000 | 24119000000 |
| Monday, January 1, 2024 | 5278300000 | 24250000000 |
In pursuit of knowledge
In the ever-evolving landscape of American business, Union Pacific Corporation and Paychex, Inc. stand as titans in their respective industries. Over the past decade, from 2014 to 2024, these companies have showcased distinct revenue trajectories. Union Pacific, a stalwart in the transportation sector, experienced a revenue dip in 2020, likely due to global disruptions, but rebounded by 2022 with a 27% increase from its 2020 low. Meanwhile, Paychex, a leader in human resource services, demonstrated consistent growth, with a remarkable 110% increase in revenue over the same period. This growth underscores the rising demand for HR solutions in a dynamic workforce environment. As we look to the future, these trends highlight the resilience and adaptability of these corporations, offering valuable insights for investors and industry watchers alike.

Union Pacific Corporation and CSX Corporation: A Comprehensive Revenue Analysis
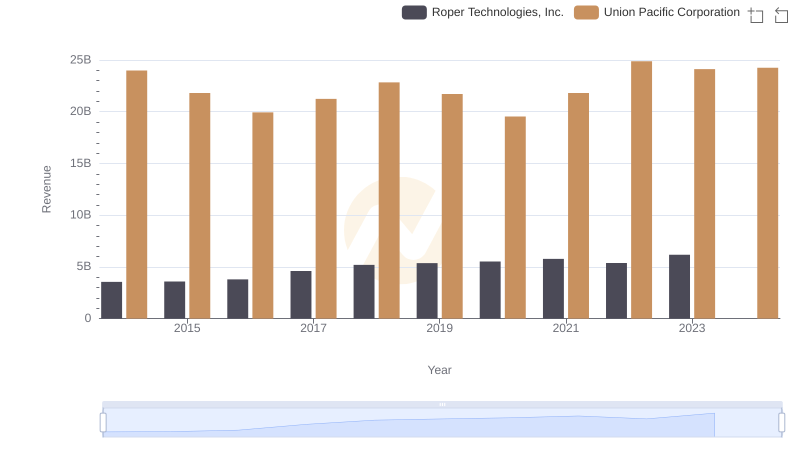
Annual Revenue Comparison: Union Pacific Corporation vs Roper Technologies, Inc.
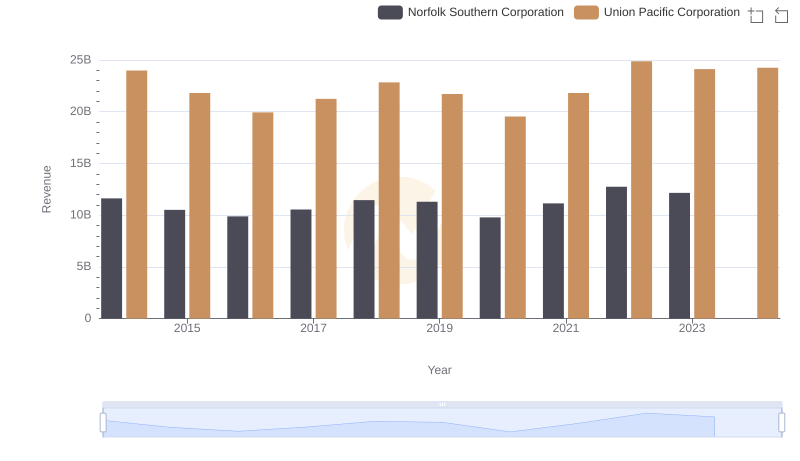
Union Pacific Corporation or Norfolk Southern Corporation: Who Leads in Yearly Revenue?
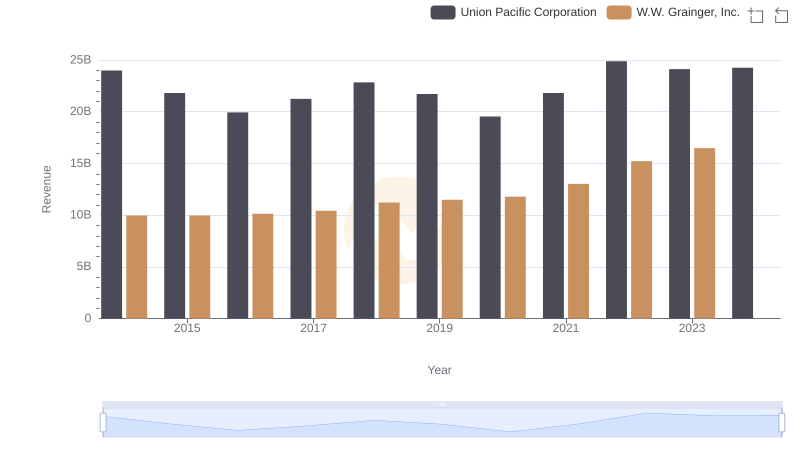
Breaking Down Revenue Trends: Union Pacific Corporation vs W.W. Grainger, Inc.
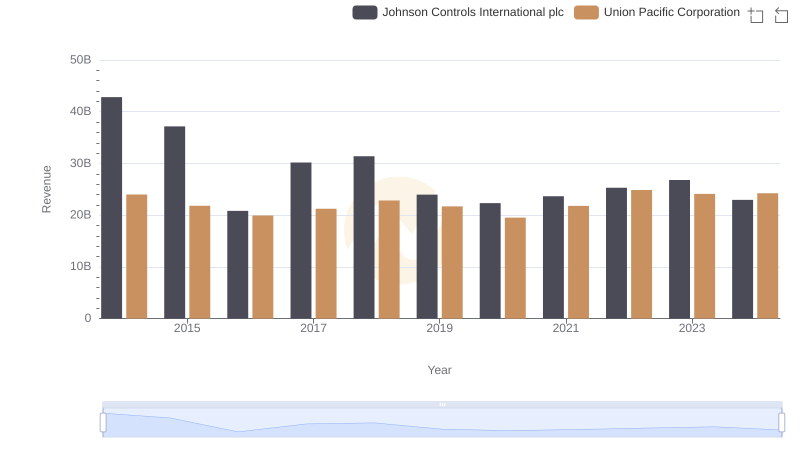
Comparing Revenue Performance: Union Pacific Corporation or Johnson Controls International plc?
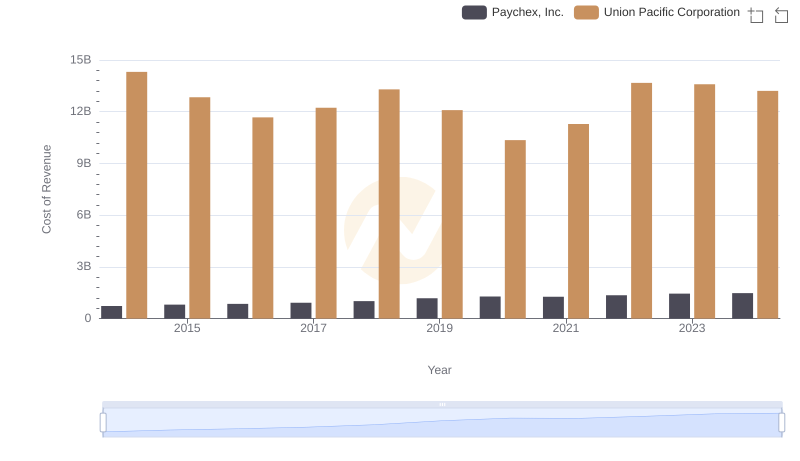
Analyzing Cost of Revenue: Union Pacific Corporation and Paychex, Inc.
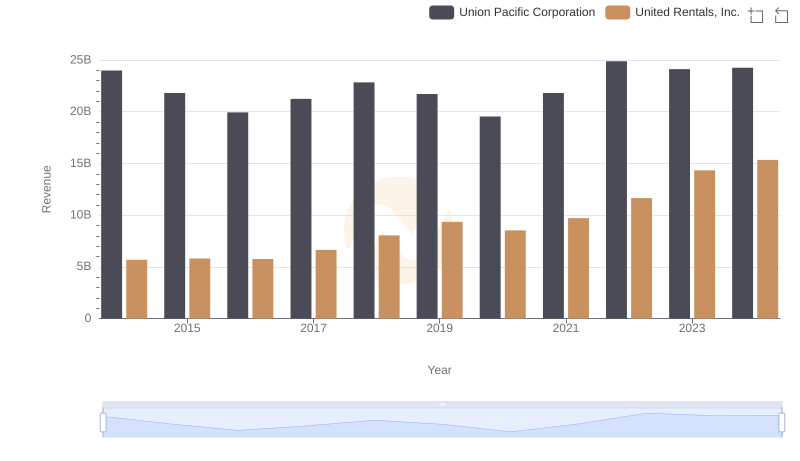
Who Generates More Revenue? Union Pacific Corporation or United Rentals, Inc.
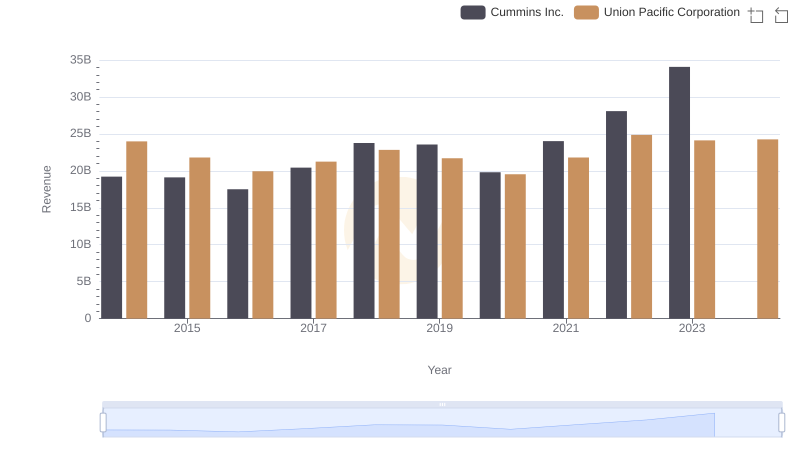
Union Pacific Corporation vs Cummins Inc.: Annual Revenue Growth Compared
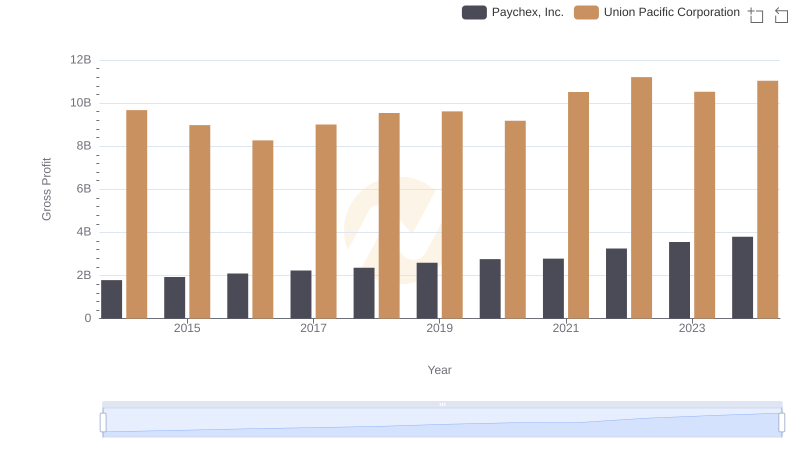
Gross Profit Analysis: Comparing Union Pacific Corporation and Paychex, Inc.
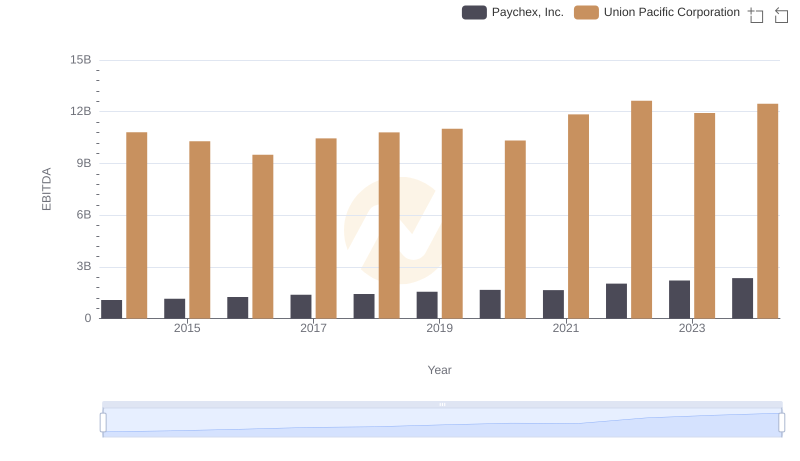
Union Pacific Corporation vs Paychex, Inc.: In-Depth EBITDA Performance Comparison