| __timestamp | Paychex, Inc. | Union Pacific Corporation |
|---|---|---|
| Wednesday, January 1, 2014 | 732500000 | 14311000000 |
| Thursday, January 1, 2015 | 808000000 | 12837000000 |
| Friday, January 1, 2016 | 857100000 | 11672000000 |
| Sunday, January 1, 2017 | 919600000 | 12231000000 |
| Monday, January 1, 2018 | 1017800000 | 13293000000 |
| Tuesday, January 1, 2019 | 1177800000 | 12094000000 |
| Wednesday, January 1, 2020 | 1280800000 | 10354000000 |
| Friday, January 1, 2021 | 1271200000 | 11290000000 |
| Saturday, January 1, 2022 | 1356300000 | 13670000000 |
| Sunday, January 1, 2023 | 1453000000 | 13590000000 |
| Monday, January 1, 2024 | 1479300000 | 13211000000 |
Data in motion
In the ever-evolving landscape of American business, understanding the cost of revenue is crucial for evaluating a company's efficiency and profitability. This analysis delves into the cost of revenue trends for Union Pacific Corporation and Paychex, Inc. from 2014 to 2024.
Union Pacific, a titan in the transportation sector, has seen its cost of revenue fluctuate, peaking in 2014 and experiencing a notable dip in 2020. This reflects the broader economic challenges faced during the pandemic. However, by 2022, Union Pacific's cost of revenue rebounded by approximately 32% from its 2020 low.
Conversely, Paychex, a leader in human resource services, has demonstrated a steady increase in its cost of revenue, growing by nearly 102% over the decade. This consistent rise underscores Paychex's expanding operations and market reach.
These insights offer a window into the strategic maneuvers of two distinct industries, highlighting resilience and growth in the face of economic shifts.
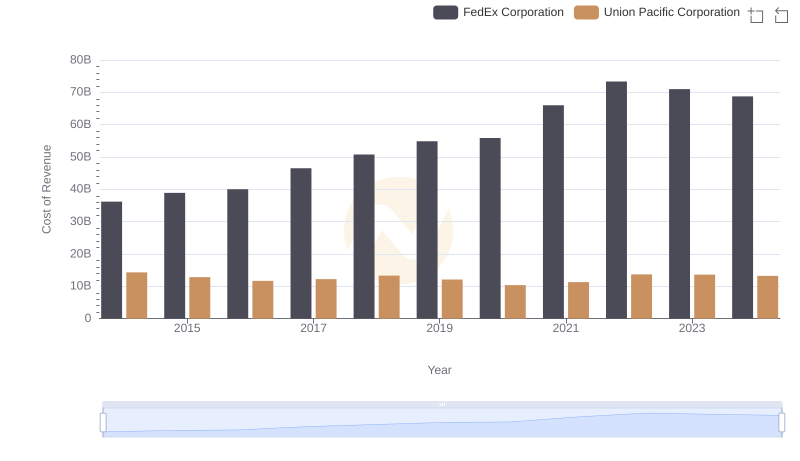
Union Pacific Corporation vs FedEx Corporation: Efficiency in Cost of Revenue Explored
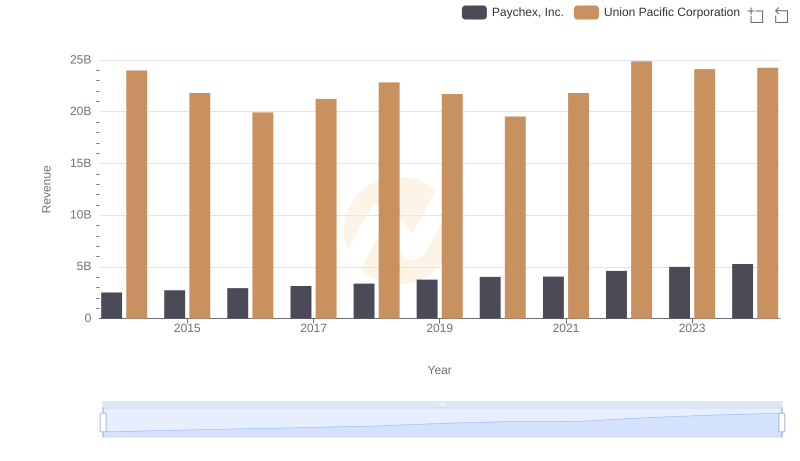
Breaking Down Revenue Trends: Union Pacific Corporation vs Paychex, Inc.
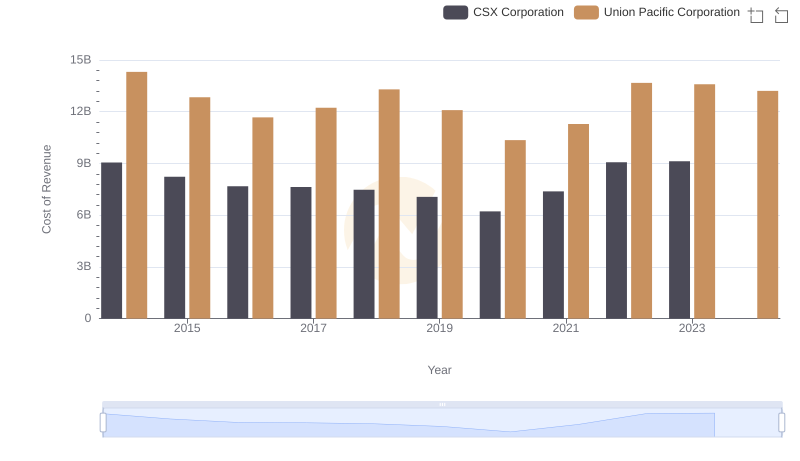
Cost of Revenue Comparison: Union Pacific Corporation vs CSX Corporation
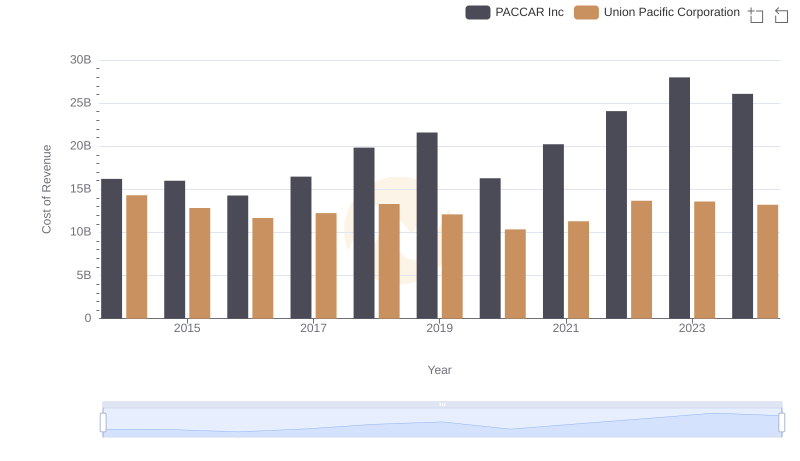
Analyzing Cost of Revenue: Union Pacific Corporation and PACCAR Inc
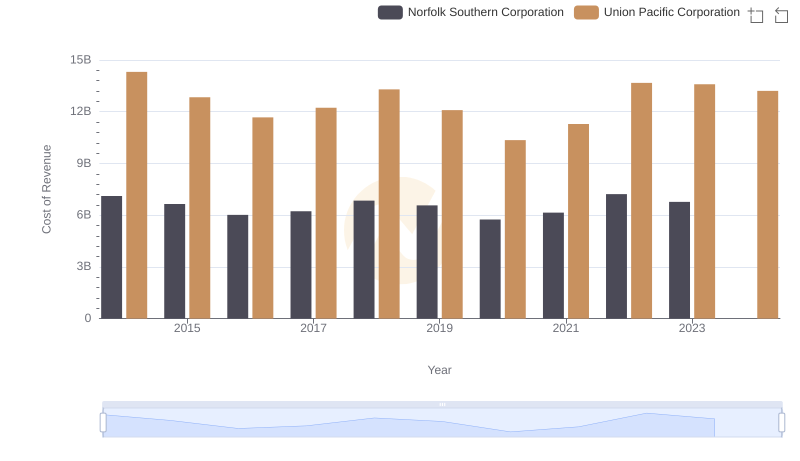
Cost Insights: Breaking Down Union Pacific Corporation and Norfolk Southern Corporation's Expenses
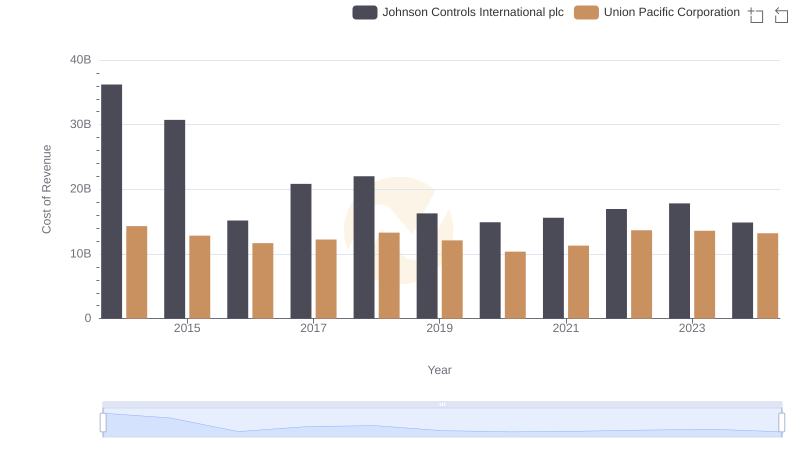
Cost of Revenue Comparison: Union Pacific Corporation vs Johnson Controls International plc
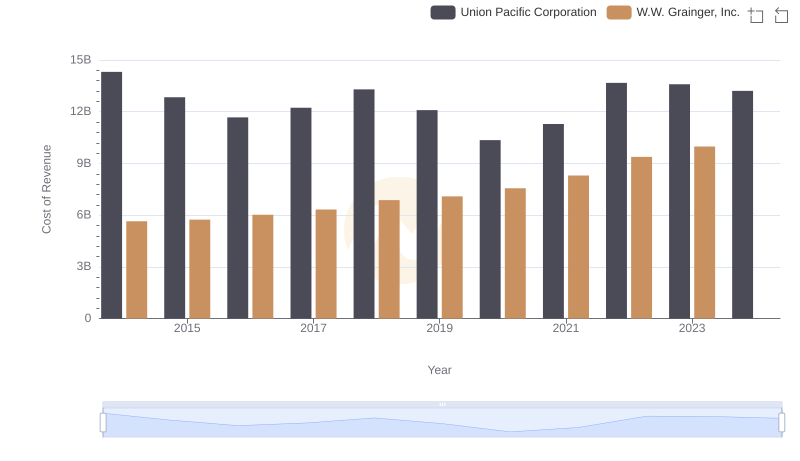
Analyzing Cost of Revenue: Union Pacific Corporation and W.W. Grainger, Inc.
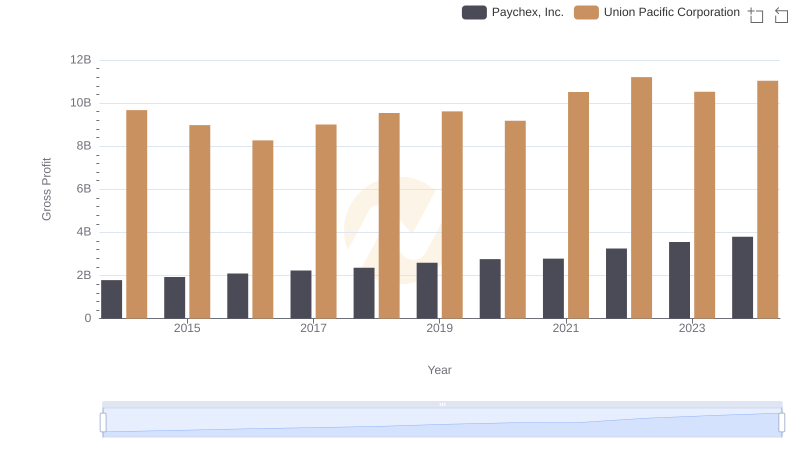
Gross Profit Analysis: Comparing Union Pacific Corporation and Paychex, Inc.
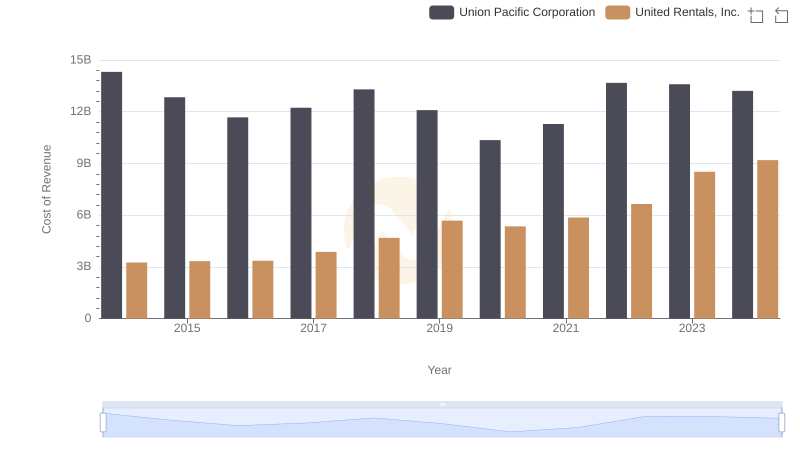
Cost of Revenue Comparison: Union Pacific Corporation vs United Rentals, Inc.
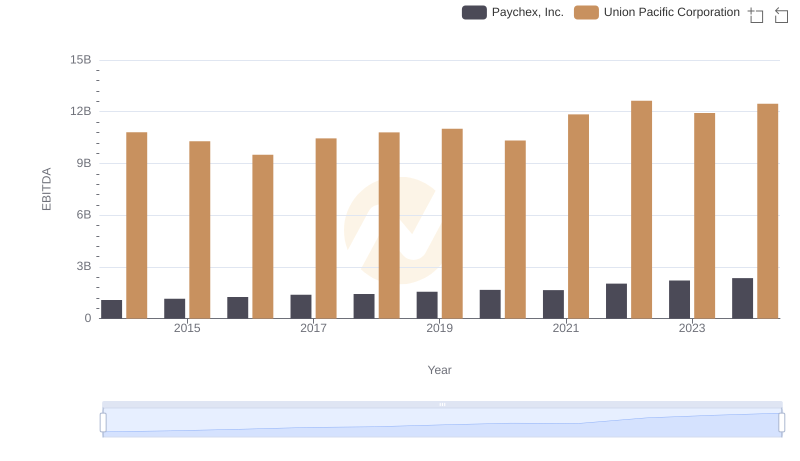
Union Pacific Corporation vs Paychex, Inc.: In-Depth EBITDA Performance Comparison