| __timestamp | Union Pacific Corporation | United Rentals, Inc. |
|---|---|---|
| Wednesday, January 1, 2014 | 23988000000 | 5685000000 |
| Thursday, January 1, 2015 | 21813000000 | 5817000000 |
| Friday, January 1, 2016 | 19941000000 | 5762000000 |
| Sunday, January 1, 2017 | 21240000000 | 6641000000 |
| Monday, January 1, 2018 | 22832000000 | 8047000000 |
| Tuesday, January 1, 2019 | 21708000000 | 9351000000 |
| Wednesday, January 1, 2020 | 19533000000 | 8530000000 |
| Friday, January 1, 2021 | 21804000000 | 9716000000 |
| Saturday, January 1, 2022 | 24875000000 | 11642000000 |
| Sunday, January 1, 2023 | 24119000000 | 14332000000 |
| Monday, January 1, 2024 | 24250000000 | 15345000000 |
Infusing magic into the data realm
In the ever-evolving landscape of American industry, two giants stand out: Union Pacific Corporation and United Rentals, Inc. Over the past decade, these companies have demonstrated remarkable growth and resilience. Union Pacific, a stalwart in the railroad sector, consistently outpaces United Rentals in revenue, boasting an average annual revenue of approximately $22 billion. In contrast, United Rentals, a leader in equipment rental, has seen its revenue grow by over 170% from 2014 to 2024, reaching nearly $15 billion.
From 2014 to 2024, Union Pacific's revenue fluctuated, peaking in 2022 with a 27% increase from its lowest point in 2020. Meanwhile, United Rentals experienced a steady upward trajectory, with a notable 80% increase from 2018 to 2024. This data highlights the dynamic nature of these industries and the strategic maneuvers each company has employed to maintain their competitive edge.
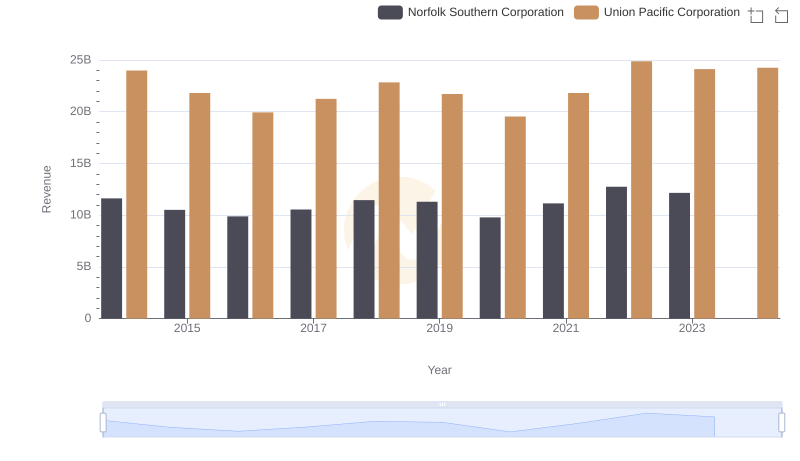
Union Pacific Corporation or Norfolk Southern Corporation: Who Leads in Yearly Revenue?
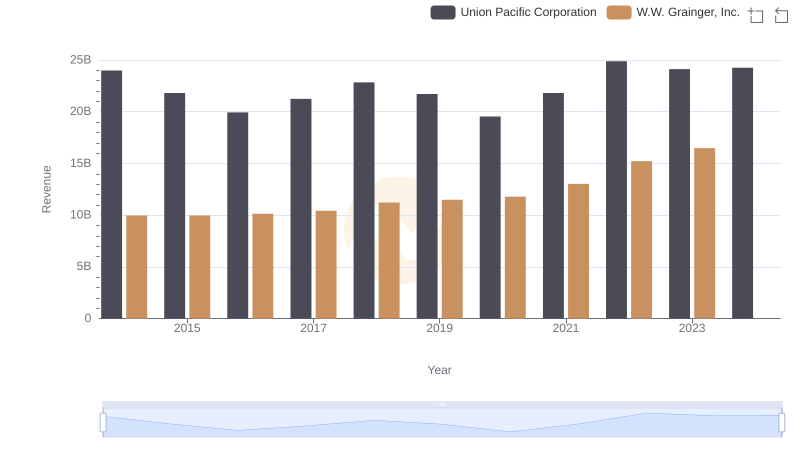
Breaking Down Revenue Trends: Union Pacific Corporation vs W.W. Grainger, Inc.
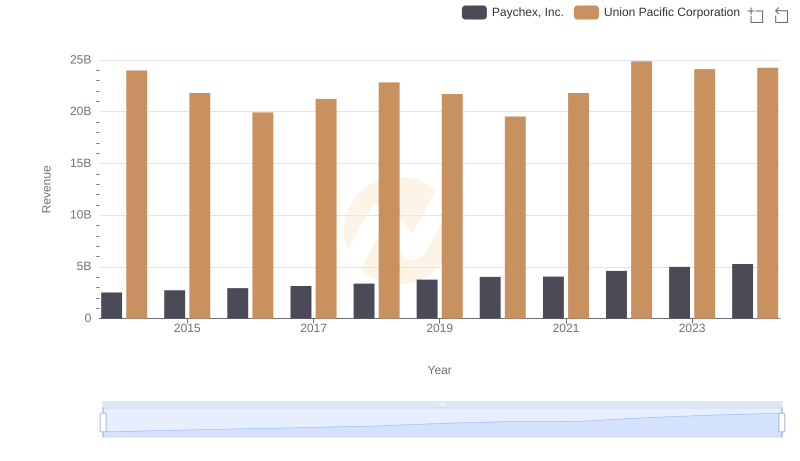
Breaking Down Revenue Trends: Union Pacific Corporation vs Paychex, Inc.
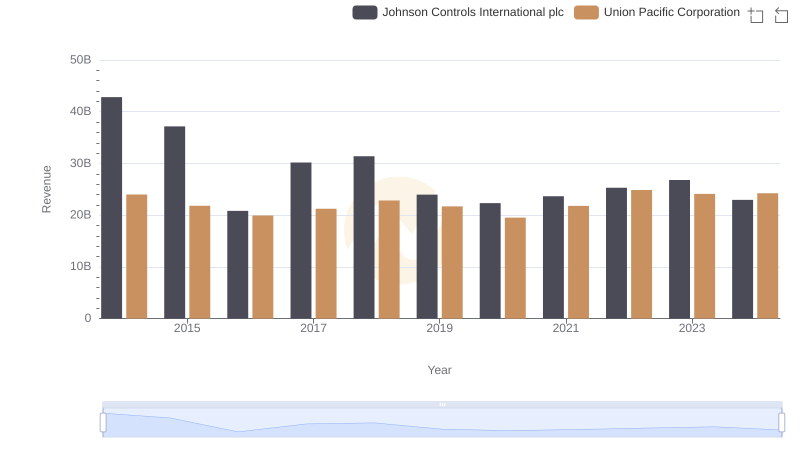
Comparing Revenue Performance: Union Pacific Corporation or Johnson Controls International plc?
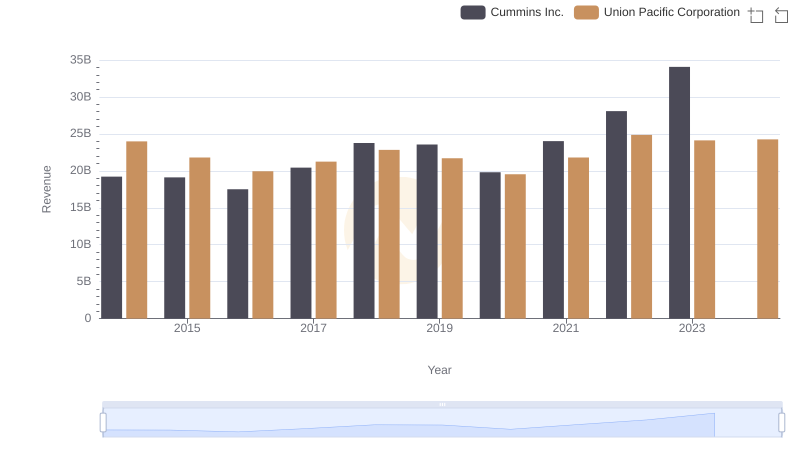
Union Pacific Corporation vs Cummins Inc.: Annual Revenue Growth Compared
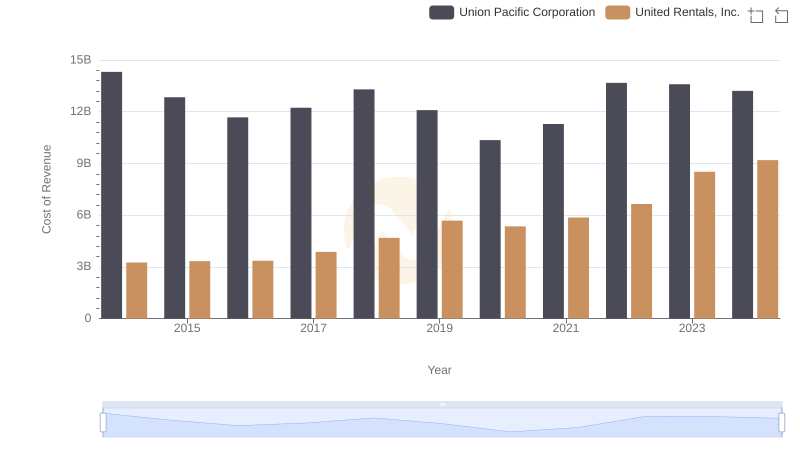
Cost of Revenue Comparison: Union Pacific Corporation vs United Rentals, Inc.
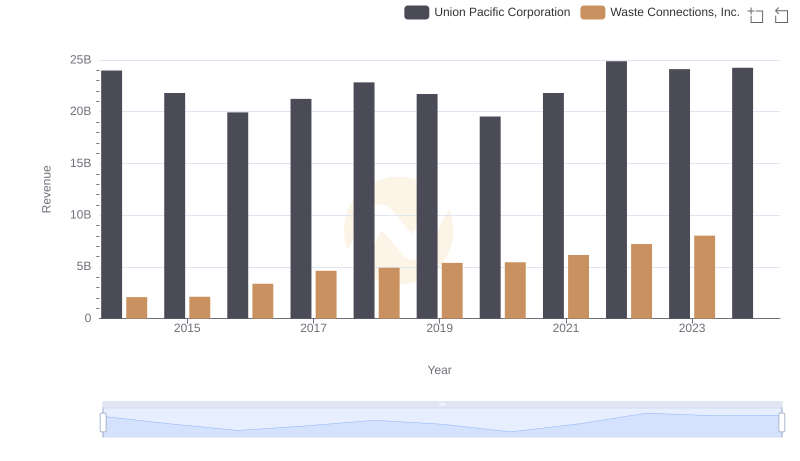
Union Pacific Corporation and Waste Connections, Inc.: A Comprehensive Revenue Analysis
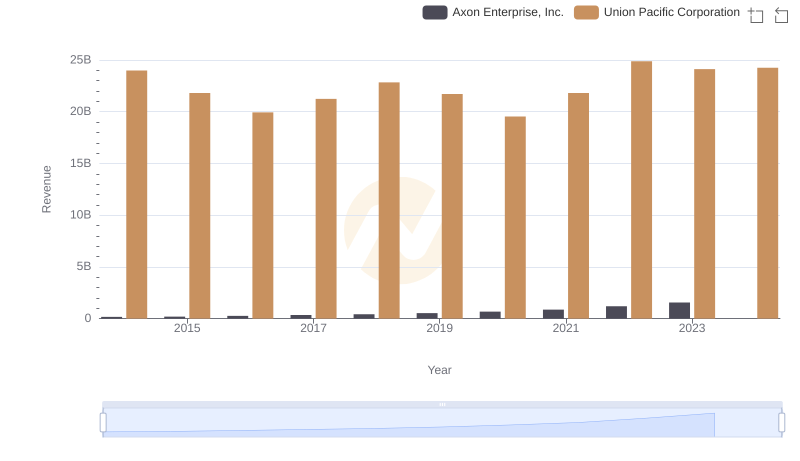
Union Pacific Corporation or Axon Enterprise, Inc.: Who Leads in Yearly Revenue?
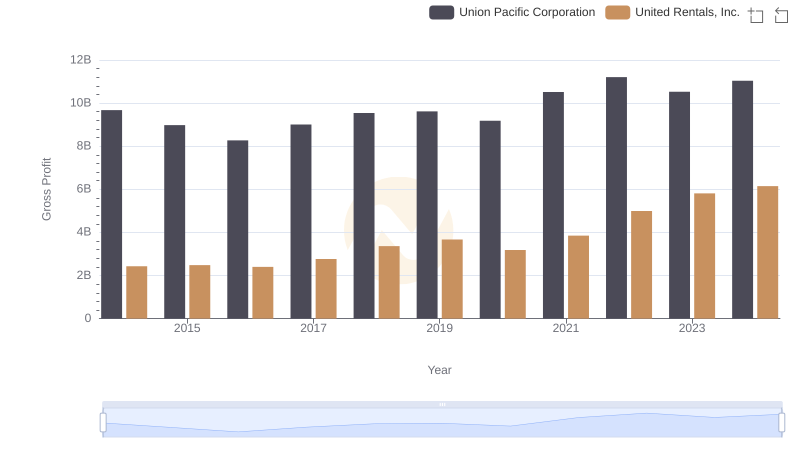
Union Pacific Corporation and United Rentals, Inc.: A Detailed Gross Profit Analysis