| __timestamp | Cummins Inc. | Union Pacific Corporation |
|---|---|---|
| Wednesday, January 1, 2014 | 19221000000 | 23988000000 |
| Thursday, January 1, 2015 | 19110000000 | 21813000000 |
| Friday, January 1, 2016 | 17509000000 | 19941000000 |
| Sunday, January 1, 2017 | 20428000000 | 21240000000 |
| Monday, January 1, 2018 | 23771000000 | 22832000000 |
| Tuesday, January 1, 2019 | 23571000000 | 21708000000 |
| Wednesday, January 1, 2020 | 19811000000 | 19533000000 |
| Friday, January 1, 2021 | 24021000000 | 21804000000 |
| Saturday, January 1, 2022 | 28074000000 | 24875000000 |
| Sunday, January 1, 2023 | 34065000000 | 24119000000 |
| Monday, January 1, 2024 | 34102000000 | 24250000000 |
Infusing magic into the data realm
In the ever-evolving landscape of American industry, Union Pacific Corporation and Cummins Inc. stand as titans of their respective fields. From 2014 to 2023, these companies have navigated economic shifts, technological advancements, and market demands, reflecting their resilience and adaptability.
Union Pacific, a stalwart in the rail transport sector, saw its revenue fluctuate modestly, peaking in 2022 with a 27% increase from its 2016 low. Meanwhile, Cummins, a leader in engine manufacturing, experienced a more dynamic growth trajectory, culminating in a remarkable 95% revenue surge by 2023 compared to 2016.
This comparative analysis highlights the distinct growth patterns of these industrial giants, offering insights into their strategic maneuvers and market positioning. As we look to the future, the missing data for 2024 invites speculation on how these companies will continue to evolve in a rapidly changing economic environment.
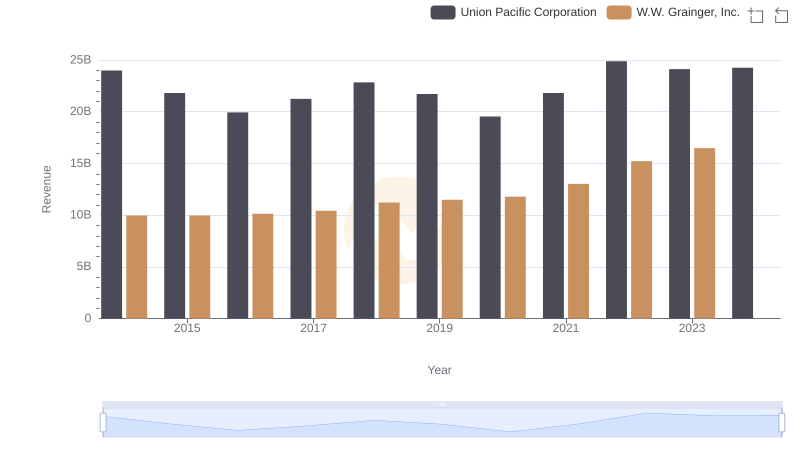
Breaking Down Revenue Trends: Union Pacific Corporation vs W.W. Grainger, Inc.
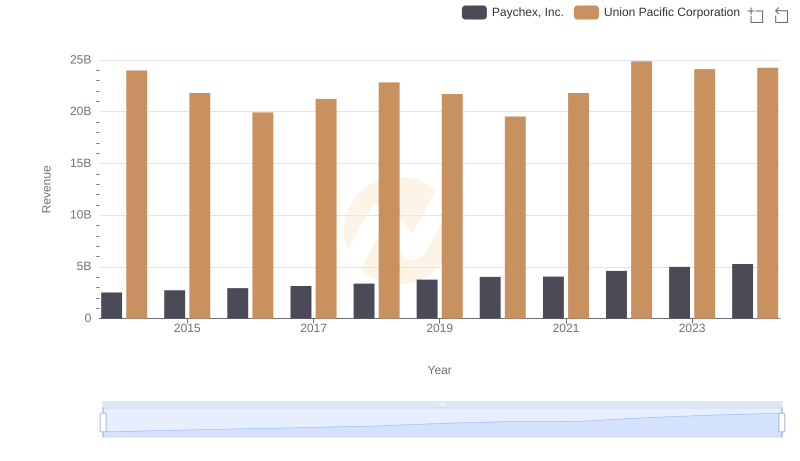
Breaking Down Revenue Trends: Union Pacific Corporation vs Paychex, Inc.
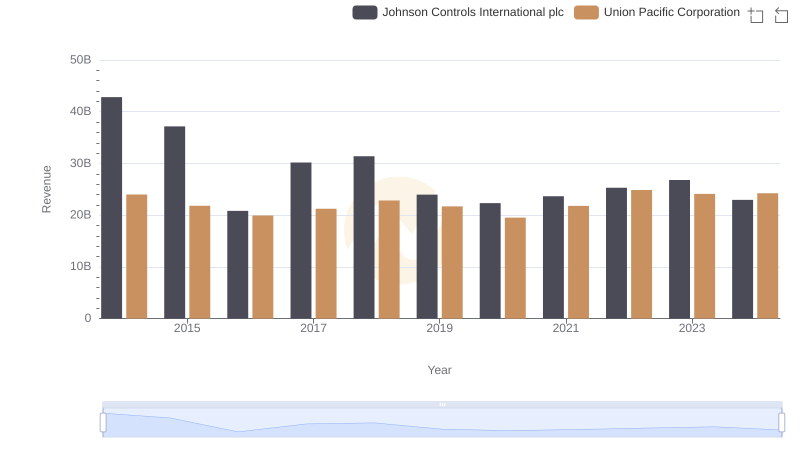
Comparing Revenue Performance: Union Pacific Corporation or Johnson Controls International plc?
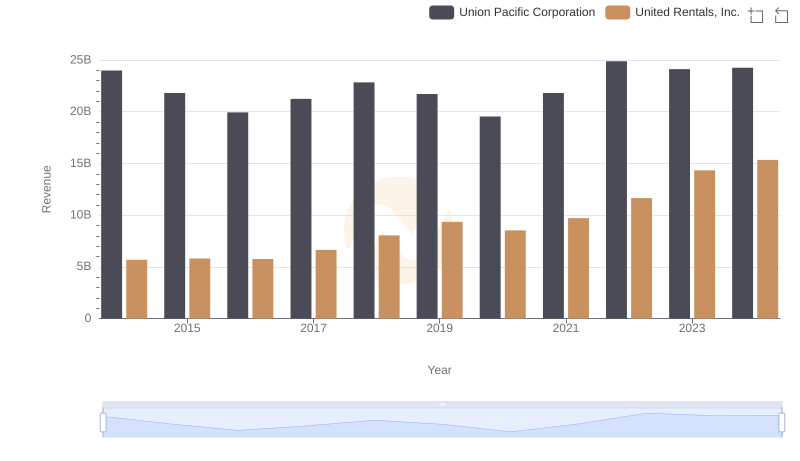
Who Generates More Revenue? Union Pacific Corporation or United Rentals, Inc.
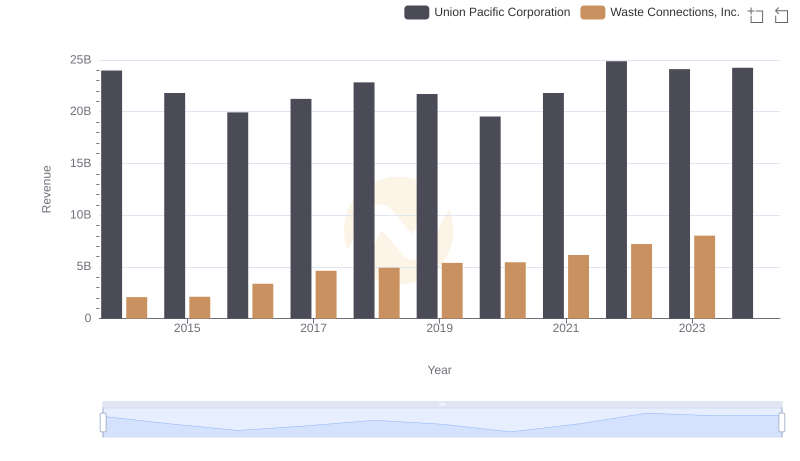
Union Pacific Corporation and Waste Connections, Inc.: A Comprehensive Revenue Analysis
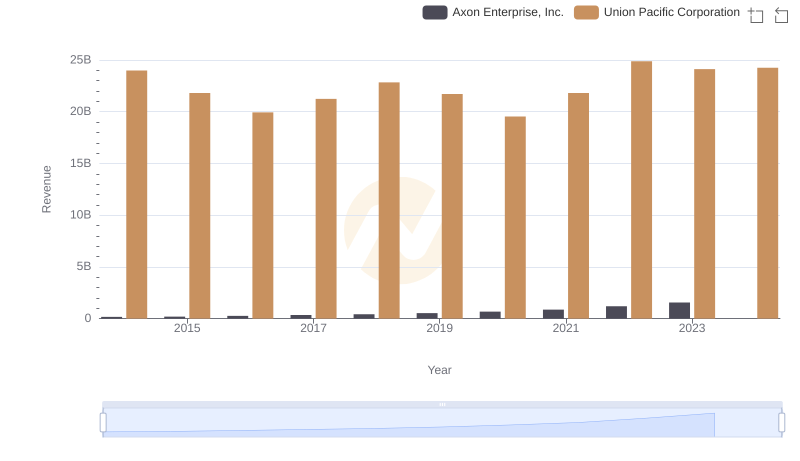
Union Pacific Corporation or Axon Enterprise, Inc.: Who Leads in Yearly Revenue?