| __timestamp | Roper Technologies, Inc. | Union Pacific Corporation |
|---|---|---|
| Wednesday, January 1, 2014 | 3549494000 | 23988000000 |
| Thursday, January 1, 2015 | 3582395000 | 21813000000 |
| Friday, January 1, 2016 | 3789925000 | 19941000000 |
| Sunday, January 1, 2017 | 4607471000 | 21240000000 |
| Monday, January 1, 2018 | 5191200000 | 22832000000 |
| Tuesday, January 1, 2019 | 5366800000 | 21708000000 |
| Wednesday, January 1, 2020 | 5527100000 | 19533000000 |
| Friday, January 1, 2021 | 5777800000 | 21804000000 |
| Saturday, January 1, 2022 | 5371800000 | 24875000000 |
| Sunday, January 1, 2023 | 6177800000 | 24119000000 |
| Monday, January 1, 2024 | 7039200000 | 24250000000 |
Data in motion
In the ever-evolving landscape of American industry, Union Pacific Corporation and Roper Technologies, Inc. stand as titans in their respective fields. Over the past decade, Union Pacific has consistently outperformed Roper Technologies in terms of annual revenue, with figures peaking at approximately $24.9 billion in 2022. This represents a robust 27% increase from its 2014 revenue. Meanwhile, Roper Technologies has shown a commendable growth trajectory, with its revenue rising by about 74% over the same period, reaching around $6.2 billion in 2023.
Despite the economic challenges of 2020, both companies demonstrated resilience, with Union Pacific bouncing back to nearly $24.1 billion in 2023. However, data for Roper Technologies in 2024 remains elusive, leaving room for speculation on its future performance. This comparison not only highlights the financial prowess of these corporations but also underscores the dynamic nature of the U.S. economy.

Union Pacific Corporation vs Northrop Grumman Corporation: Examining Key Revenue Metrics

Union Pacific Corporation and CSX Corporation: A Comprehensive Revenue Analysis
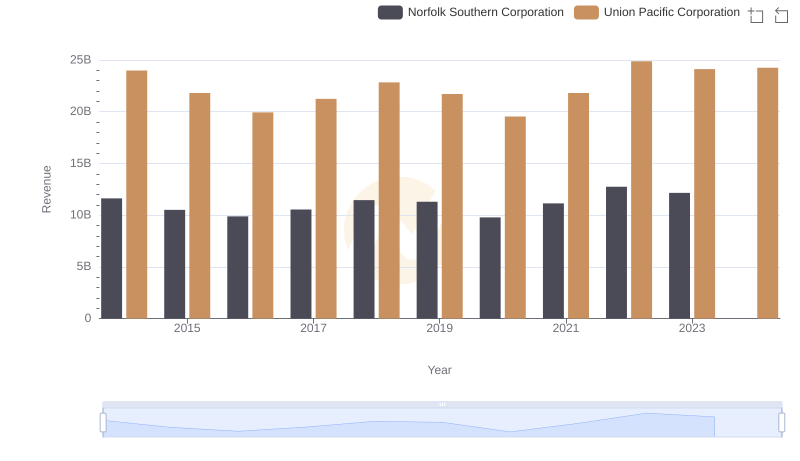
Union Pacific Corporation or Norfolk Southern Corporation: Who Leads in Yearly Revenue?
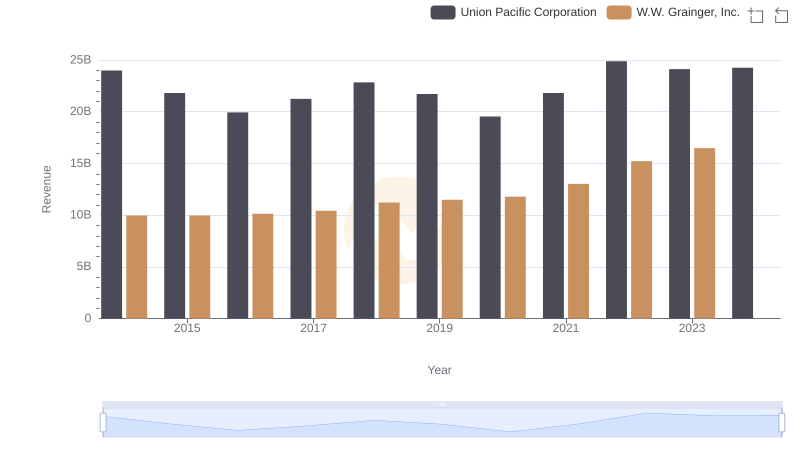
Breaking Down Revenue Trends: Union Pacific Corporation vs W.W. Grainger, Inc.
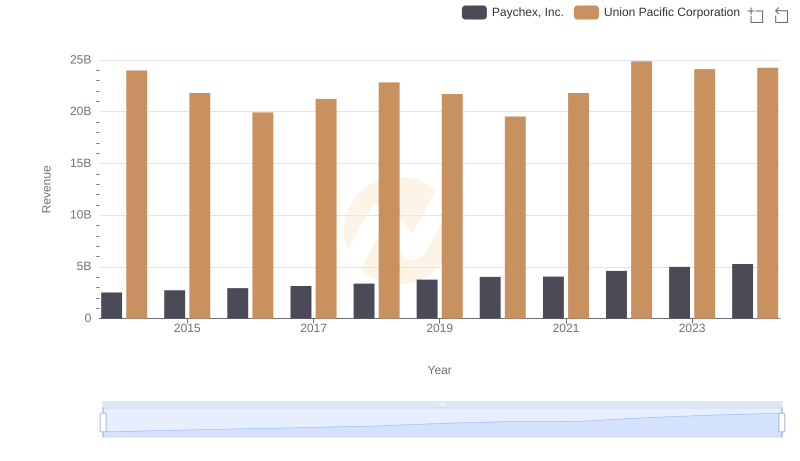
Breaking Down Revenue Trends: Union Pacific Corporation vs Paychex, Inc.
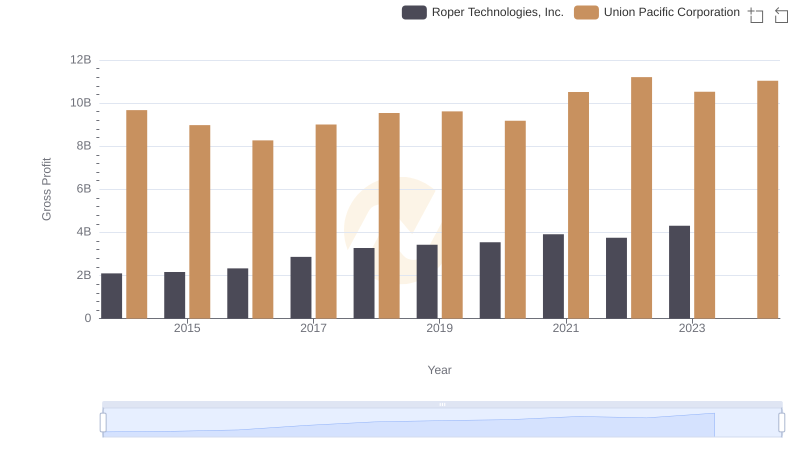
Who Generates Higher Gross Profit? Union Pacific Corporation or Roper Technologies, Inc.