| __timestamp | CSX Corporation | Union Pacific Corporation |
|---|---|---|
| Wednesday, January 1, 2014 | 12669000000 | 23988000000 |
| Thursday, January 1, 2015 | 11811000000 | 21813000000 |
| Friday, January 1, 2016 | 11069000000 | 19941000000 |
| Sunday, January 1, 2017 | 11408000000 | 21240000000 |
| Monday, January 1, 2018 | 12250000000 | 22832000000 |
| Tuesday, January 1, 2019 | 11937000000 | 21708000000 |
| Wednesday, January 1, 2020 | 10583000000 | 19533000000 |
| Friday, January 1, 2021 | 12522000000 | 21804000000 |
| Saturday, January 1, 2022 | 14853000000 | 24875000000 |
| Sunday, January 1, 2023 | 14657000000 | 24119000000 |
| Monday, January 1, 2024 | 24250000000 |
Igniting the spark of knowledge
In the ever-evolving landscape of American railroads, Union Pacific Corporation and CSX Corporation have been pivotal players. Over the past decade, from 2014 to 2023, these giants have showcased intriguing revenue trends. Union Pacific consistently outperformed CSX, with revenues peaking in 2022 at approximately 2.49 times that of CSX's. Notably, Union Pacific's revenue saw a steady climb, with a slight dip in 2020, likely due to global disruptions. Meanwhile, CSX experienced more volatility, with a significant revenue increase of about 40% from 2020 to 2022. The data for 2024 is incomplete, but Union Pacific's resilience is evident. This analysis highlights the dynamic nature of the rail industry and the strategic maneuvers of these corporations to maintain their competitive edge.

Union Pacific Corporation vs Northrop Grumman Corporation: Examining Key Revenue Metrics
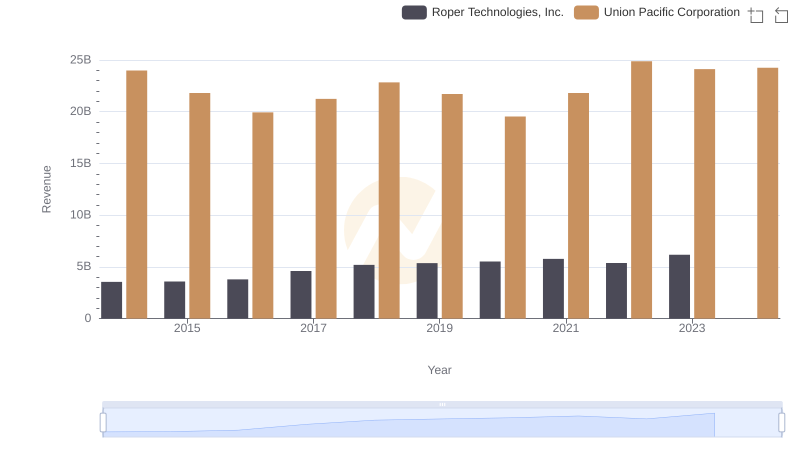
Annual Revenue Comparison: Union Pacific Corporation vs Roper Technologies, Inc.
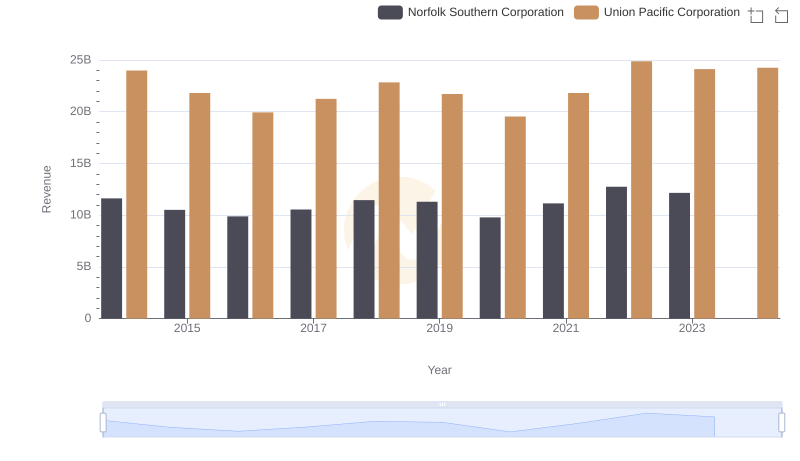
Union Pacific Corporation or Norfolk Southern Corporation: Who Leads in Yearly Revenue?
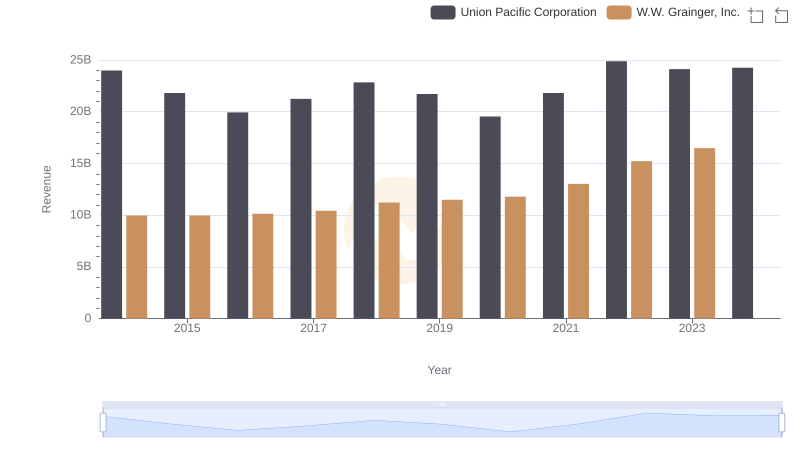
Breaking Down Revenue Trends: Union Pacific Corporation vs W.W. Grainger, Inc.
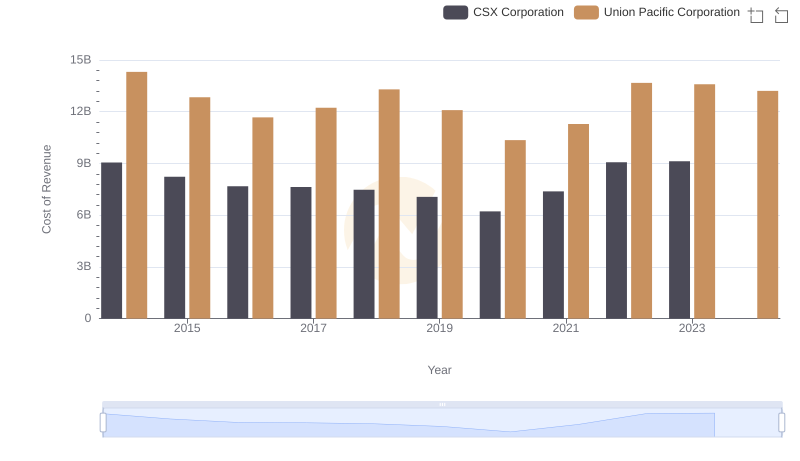
Cost of Revenue Comparison: Union Pacific Corporation vs CSX Corporation
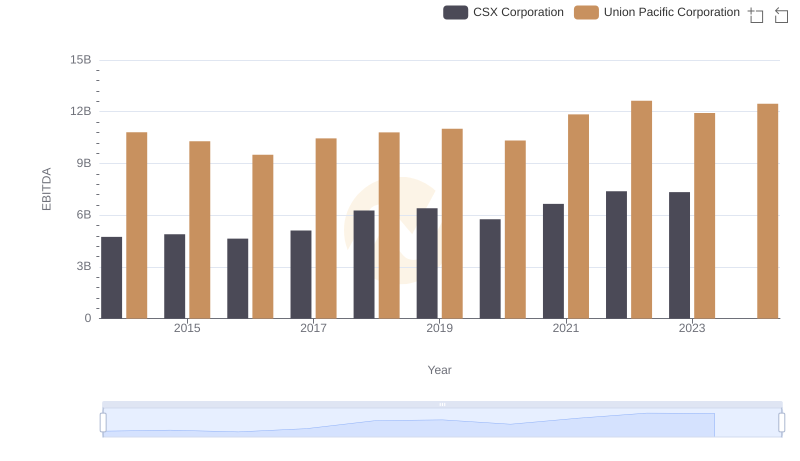
A Side-by-Side Analysis of EBITDA: Union Pacific Corporation and CSX Corporation