| __timestamp | Johnson Controls International plc | Union Pacific Corporation |
|---|---|---|
| Wednesday, January 1, 2014 | 42828000000 | 23988000000 |
| Thursday, January 1, 2015 | 37179000000 | 21813000000 |
| Friday, January 1, 2016 | 20837000000 | 19941000000 |
| Sunday, January 1, 2017 | 30172000000 | 21240000000 |
| Monday, January 1, 2018 | 31400000000 | 22832000000 |
| Tuesday, January 1, 2019 | 23968000000 | 21708000000 |
| Wednesday, January 1, 2020 | 22317000000 | 19533000000 |
| Friday, January 1, 2021 | 23668000000 | 21804000000 |
| Saturday, January 1, 2022 | 25299000000 | 24875000000 |
| Sunday, January 1, 2023 | 26793000000 | 24119000000 |
| Monday, January 1, 2024 | 22952000000 | 24250000000 |
Unleashing insights
In the ever-evolving landscape of American industry, Union Pacific Corporation and Johnson Controls International plc stand as titans in their respective fields. Over the past decade, these companies have showcased contrasting revenue trajectories. From 2014 to 2024, Johnson Controls experienced a notable decline, with revenue dropping approximately 46% from its peak in 2014. In contrast, Union Pacific demonstrated resilience, maintaining a relatively stable revenue stream with a slight increase of around 1% over the same period.
This data highlights the dynamic nature of business performance and the importance of strategic adaptation in maintaining market leadership.

Union Pacific Corporation and CSX Corporation: A Comprehensive Revenue Analysis
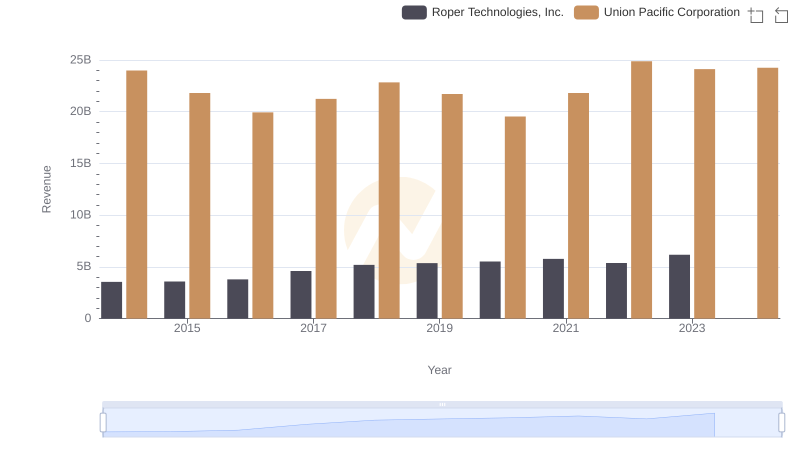
Annual Revenue Comparison: Union Pacific Corporation vs Roper Technologies, Inc.
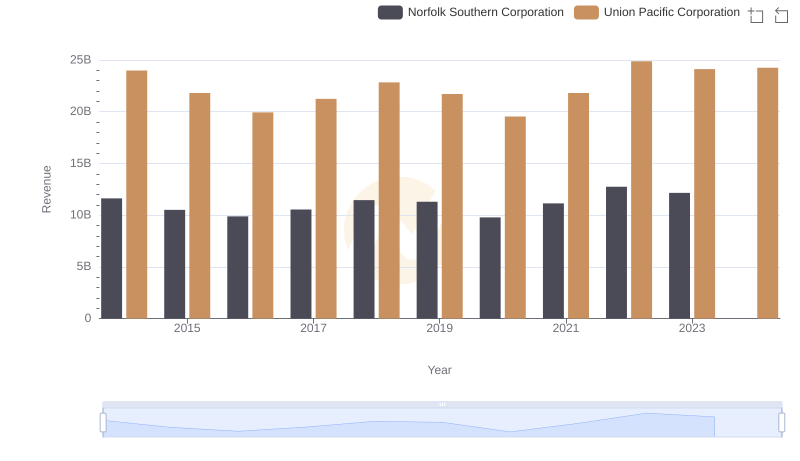
Union Pacific Corporation or Norfolk Southern Corporation: Who Leads in Yearly Revenue?
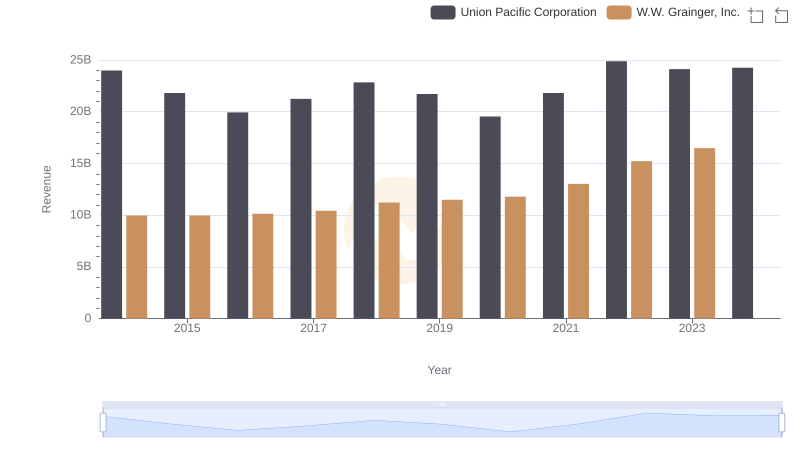
Breaking Down Revenue Trends: Union Pacific Corporation vs W.W. Grainger, Inc.
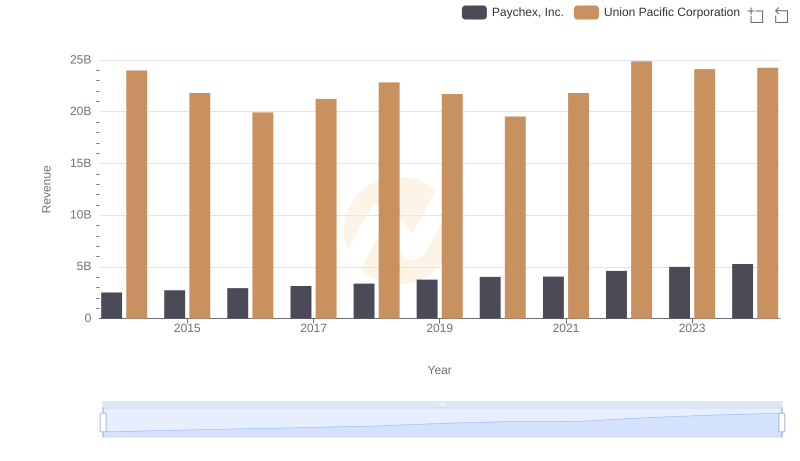
Breaking Down Revenue Trends: Union Pacific Corporation vs Paychex, Inc.
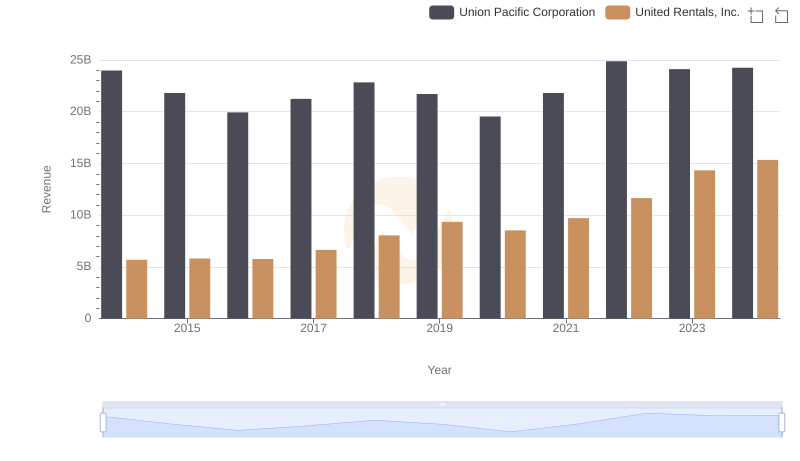
Who Generates More Revenue? Union Pacific Corporation or United Rentals, Inc.
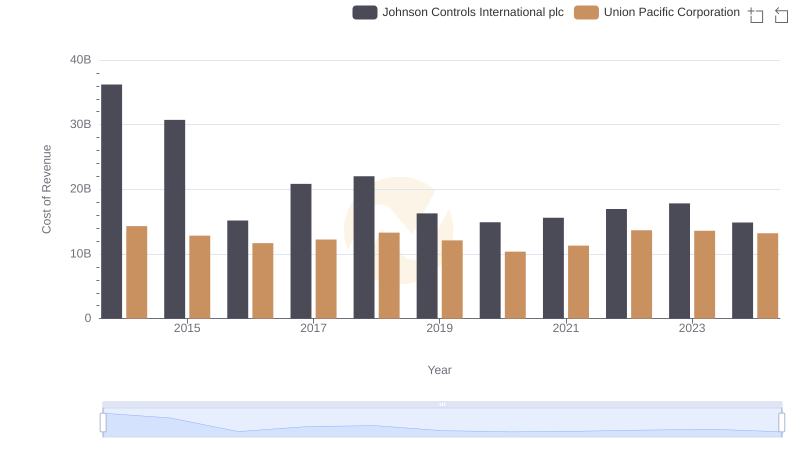
Cost of Revenue Comparison: Union Pacific Corporation vs Johnson Controls International plc
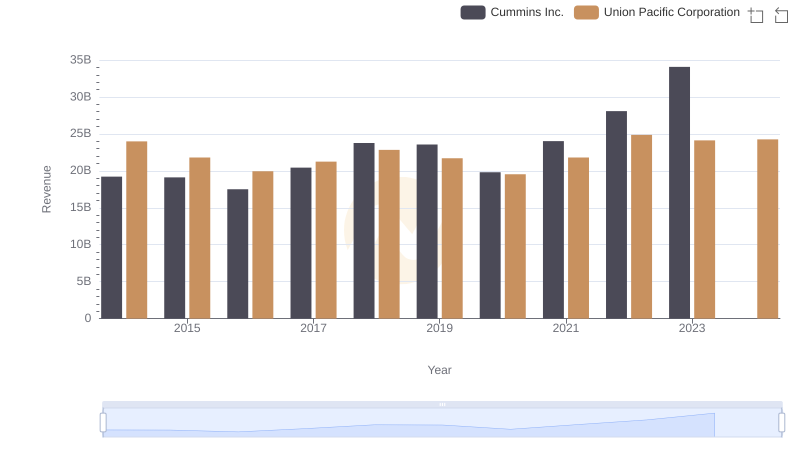
Union Pacific Corporation vs Cummins Inc.: Annual Revenue Growth Compared