| __timestamp | Paychex, Inc. | Union Pacific Corporation |
|---|---|---|
| Wednesday, January 1, 2014 | 1082300000 | 10808000000 |
| Thursday, January 1, 2015 | 1153800000 | 10290000000 |
| Friday, January 1, 2016 | 1257200000 | 9502000000 |
| Sunday, January 1, 2017 | 1380800000 | 10456000000 |
| Monday, January 1, 2018 | 1429500000 | 10802000000 |
| Tuesday, January 1, 2019 | 1558100000 | 11013000000 |
| Wednesday, January 1, 2020 | 1670200000 | 10331000000 |
| Friday, January 1, 2021 | 1652700000 | 11843000000 |
| Saturday, January 1, 2022 | 2031800000 | 12636000000 |
| Sunday, January 1, 2023 | 2209700000 | 11928000000 |
| Monday, January 1, 2024 | 2350600000 | 12461000000 |
Unleashing insights
In the ever-evolving landscape of American business, Union Pacific Corporation and Paychex, Inc. stand as titans in their respective industries. Over the past decade, from 2014 to 2024, these companies have showcased remarkable EBITDA performance, reflecting their operational efficiency and market resilience.
Union Pacific Corporation, a leader in the transportation sector, consistently outperformed with an average EBITDA of approximately $11 billion annually. Despite fluctuations, it reached a peak in 2022, marking a 33% increase from its lowest point in 2016.
Conversely, Paychex, Inc., a stalwart in the payroll and HR services industry, demonstrated steady growth. From 2014 to 2024, its EBITDA surged by over 117%, highlighting its robust business model and adaptability.
This comparative analysis underscores the diverse strategies and market dynamics that drive success in different sectors, offering valuable insights for investors and industry enthusiasts alike.
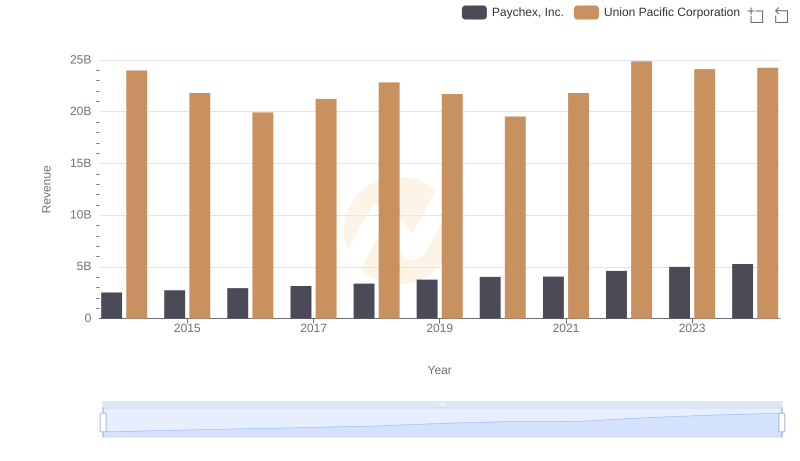
Breaking Down Revenue Trends: Union Pacific Corporation vs Paychex, Inc.
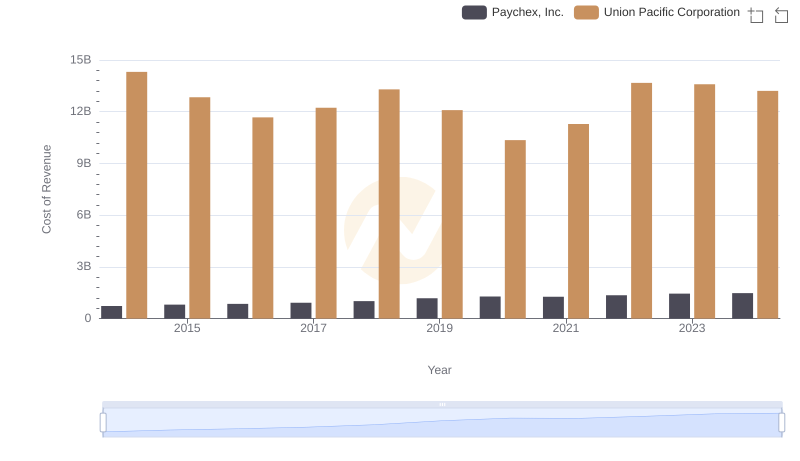
Analyzing Cost of Revenue: Union Pacific Corporation and Paychex, Inc.
EBITDA Metrics Evaluated: Union Pacific Corporation vs Canadian National Railway Company
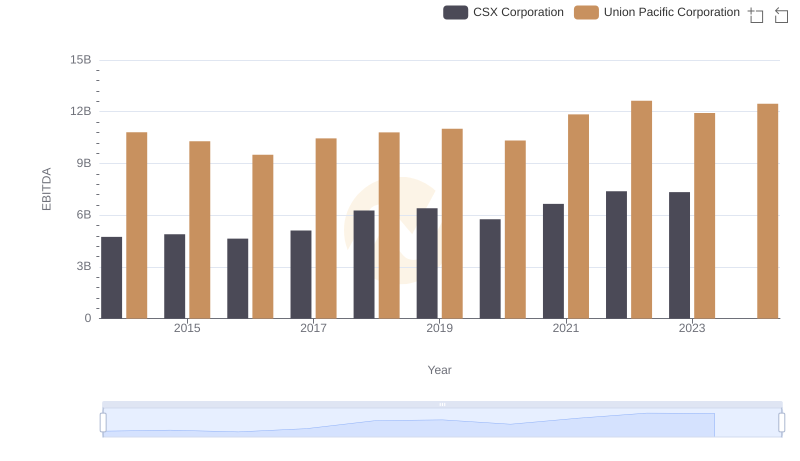
A Side-by-Side Analysis of EBITDA: Union Pacific Corporation and CSX Corporation
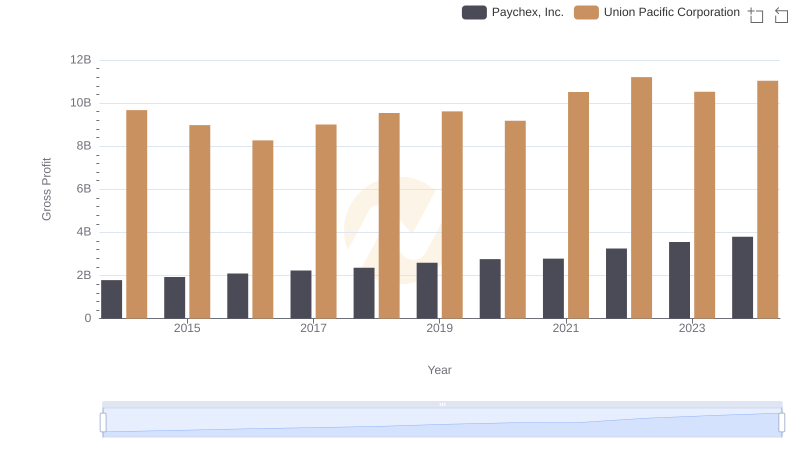
Gross Profit Analysis: Comparing Union Pacific Corporation and Paychex, Inc.
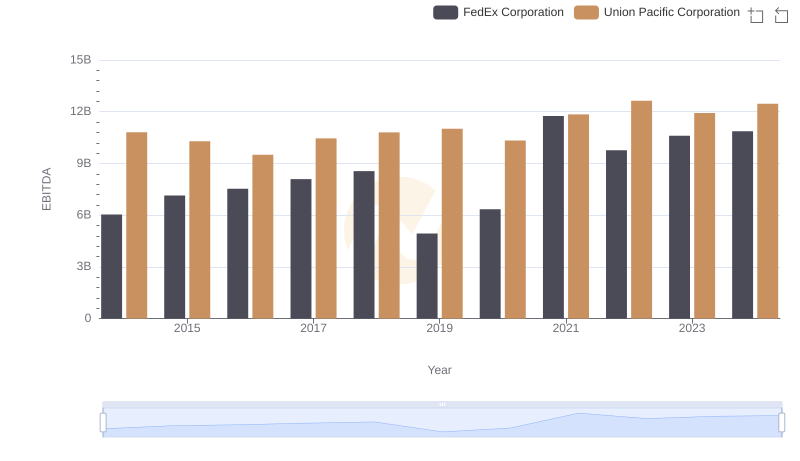
A Professional Review of EBITDA: Union Pacific Corporation Compared to FedEx Corporation
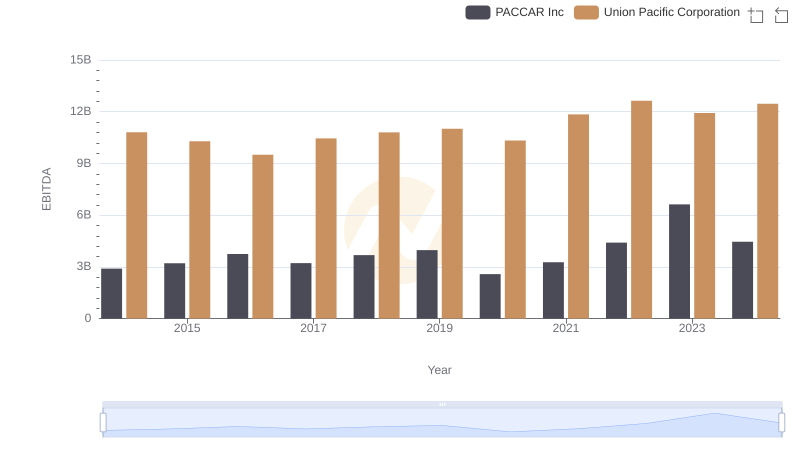
A Professional Review of EBITDA: Union Pacific Corporation Compared to PACCAR Inc