| __timestamp | Union Pacific Corporation | W.W. Grainger, Inc. |
|---|---|---|
| Wednesday, January 1, 2014 | 23988000000 | 9964953000 |
| Thursday, January 1, 2015 | 21813000000 | 9973384000 |
| Friday, January 1, 2016 | 19941000000 | 10137204000 |
| Sunday, January 1, 2017 | 21240000000 | 10424858000 |
| Monday, January 1, 2018 | 22832000000 | 11221000000 |
| Tuesday, January 1, 2019 | 21708000000 | 11486000000 |
| Wednesday, January 1, 2020 | 19533000000 | 11797000000 |
| Friday, January 1, 2021 | 21804000000 | 13022000000 |
| Saturday, January 1, 2022 | 24875000000 | 15228000000 |
| Sunday, January 1, 2023 | 24119000000 | 16478000000 |
| Monday, January 1, 2024 | 24250000000 | 17168000000 |
Data in motion
In the ever-evolving landscape of American industry, Union Pacific Corporation and W.W. Grainger, Inc. stand as titans in their respective fields. From 2014 to 2023, Union Pacific's revenue showcased a dynamic journey, peaking in 2022 with a 25% increase from its 2016 low. Meanwhile, W.W. Grainger, Inc. demonstrated a robust growth trajectory, with a remarkable 65% rise in revenue over the same period, culminating in 2023. This comparison highlights the resilience and adaptability of these companies amidst economic fluctuations. Notably, 2020 marked a challenging year for Union Pacific, with a dip in revenue, while W.W. Grainger continued its upward trend. As we look to the future, the absence of 2024 data for W.W. Grainger leaves room for speculation on its continued growth. These insights offer a compelling narrative of industrial strength and strategic foresight.

Union Pacific Corporation and CSX Corporation: A Comprehensive Revenue Analysis
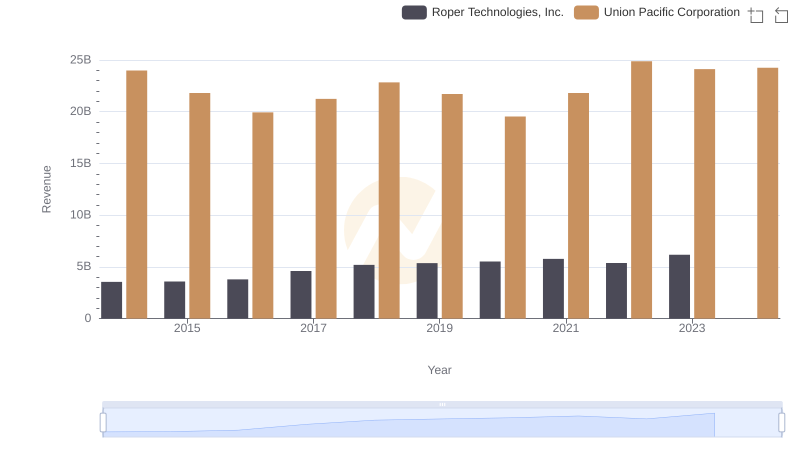
Annual Revenue Comparison: Union Pacific Corporation vs Roper Technologies, Inc.
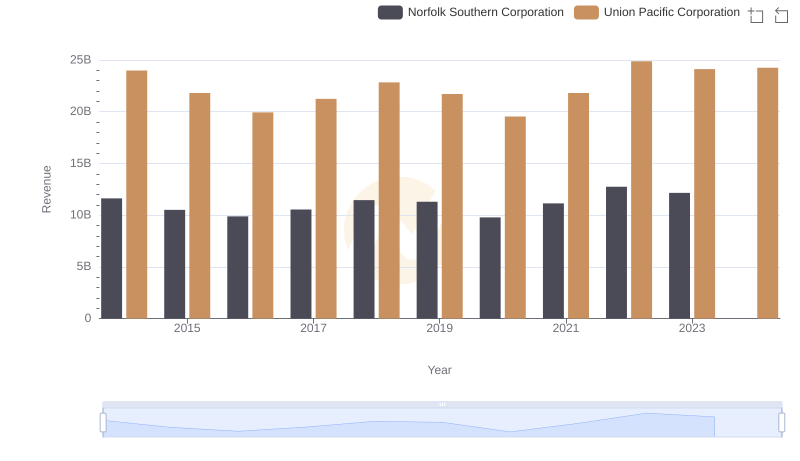
Union Pacific Corporation or Norfolk Southern Corporation: Who Leads in Yearly Revenue?
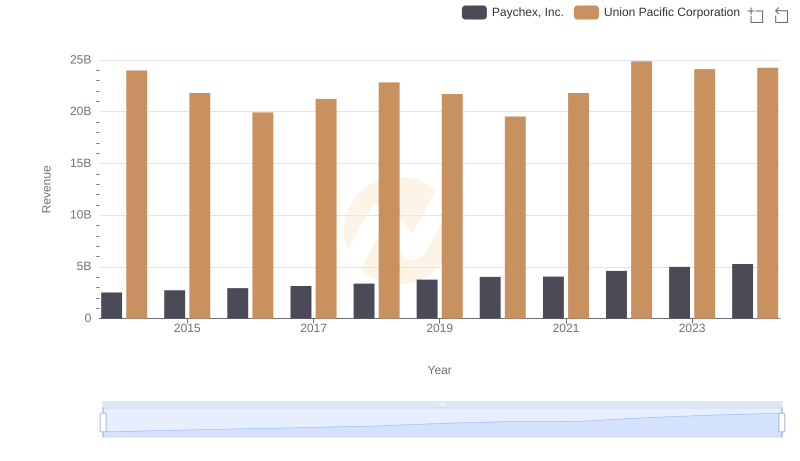
Breaking Down Revenue Trends: Union Pacific Corporation vs Paychex, Inc.
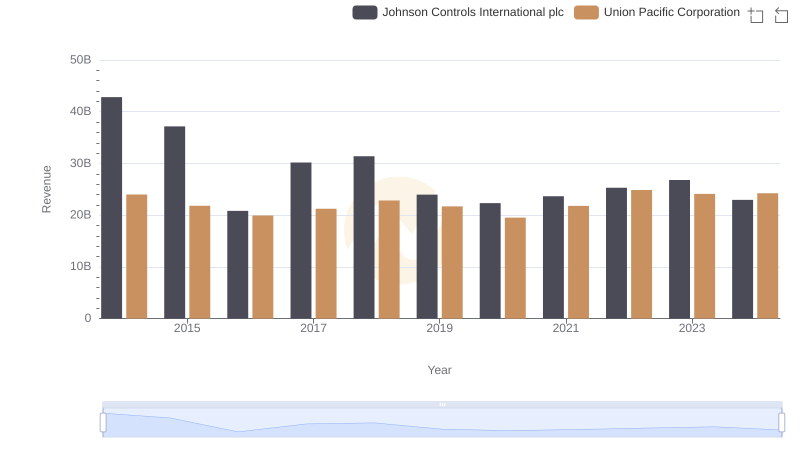
Comparing Revenue Performance: Union Pacific Corporation or Johnson Controls International plc?
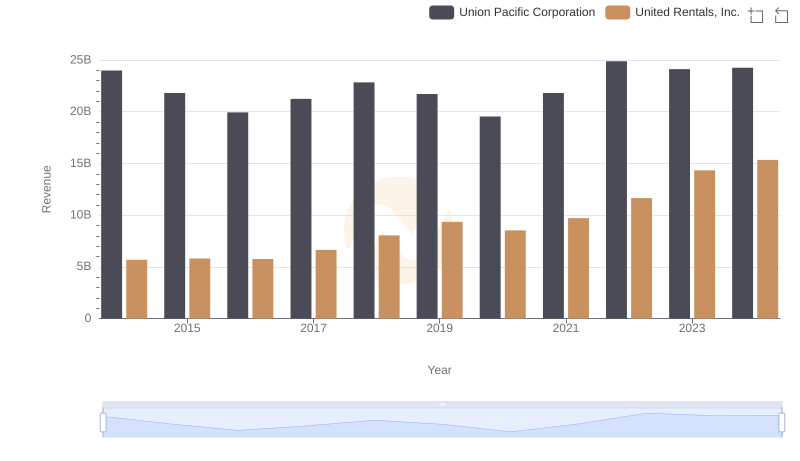
Who Generates More Revenue? Union Pacific Corporation or United Rentals, Inc.
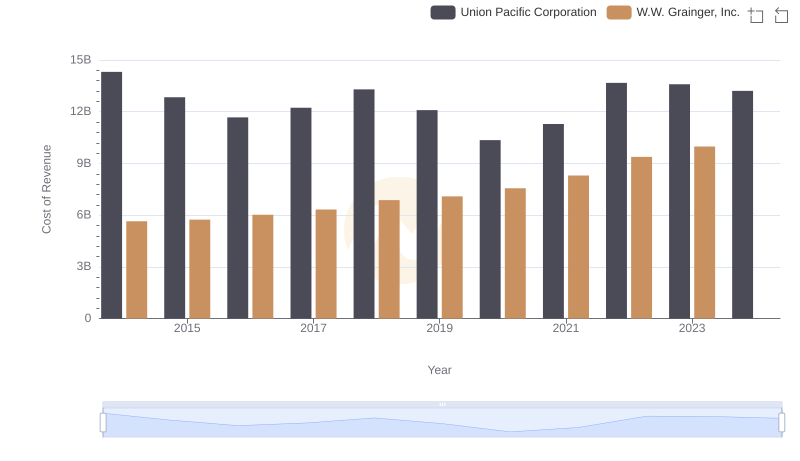
Analyzing Cost of Revenue: Union Pacific Corporation and W.W. Grainger, Inc.
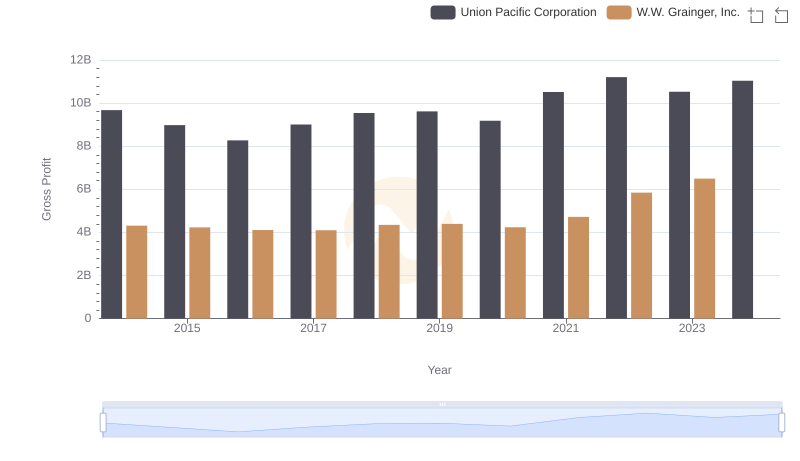
Union Pacific Corporation and W.W. Grainger, Inc.: A Detailed Gross Profit Analysis