| __timestamp | Norfolk Southern Corporation | Union Pacific Corporation |
|---|---|---|
| Wednesday, January 1, 2014 | 11624000000 | 23988000000 |
| Thursday, January 1, 2015 | 10511000000 | 21813000000 |
| Friday, January 1, 2016 | 9888000000 | 19941000000 |
| Sunday, January 1, 2017 | 10551000000 | 21240000000 |
| Monday, January 1, 2018 | 11458000000 | 22832000000 |
| Tuesday, January 1, 2019 | 11296000000 | 21708000000 |
| Wednesday, January 1, 2020 | 9789000000 | 19533000000 |
| Friday, January 1, 2021 | 11142000000 | 21804000000 |
| Saturday, January 1, 2022 | 12745000000 | 24875000000 |
| Sunday, January 1, 2023 | 12156000000 | 24119000000 |
| Monday, January 1, 2024 | 12123000000 | 24250000000 |
Cracking the code
In the competitive world of rail transportation, Union Pacific Corporation and Norfolk Southern Corporation have been industry titans. Over the past decade, Union Pacific has consistently outpaced Norfolk Southern in annual revenue. From 2014 to 2023, Union Pacific's revenue averaged around $22.4 billion, nearly double Norfolk Southern's $11.1 billion. Notably, in 2022, Union Pacific reached a peak revenue of approximately $24.9 billion, while Norfolk Southern hit its highest at $12.7 billion. This trend highlights Union Pacific's dominant market position, maintaining a revenue lead of about 100% over its rival. However, 2024 data for Norfolk Southern is missing, leaving room for speculation on whether they can close the gap. As the rail industry evolves, these giants continue to shape the economic landscape, with Union Pacific leading the charge.

Union Pacific Corporation vs Northrop Grumman Corporation: Examining Key Revenue Metrics

Union Pacific Corporation and CSX Corporation: A Comprehensive Revenue Analysis
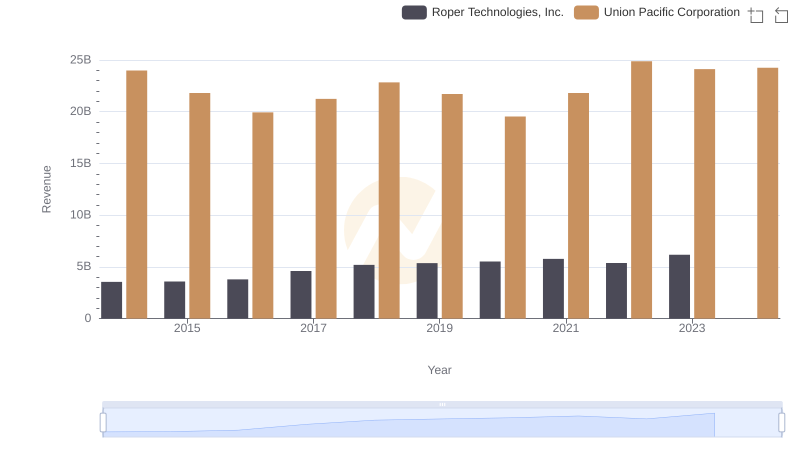
Annual Revenue Comparison: Union Pacific Corporation vs Roper Technologies, Inc.
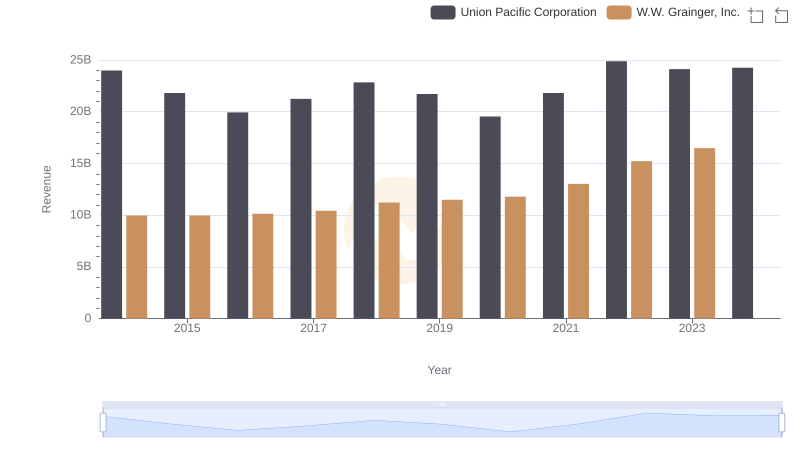
Breaking Down Revenue Trends: Union Pacific Corporation vs W.W. Grainger, Inc.
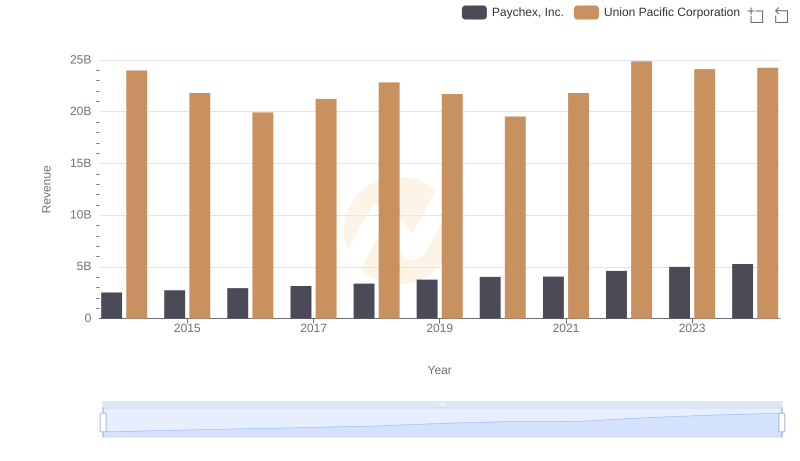
Breaking Down Revenue Trends: Union Pacific Corporation vs Paychex, Inc.
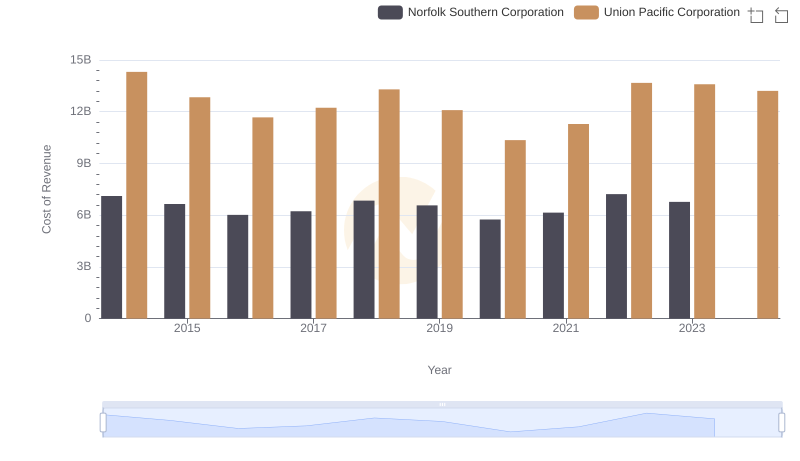
Cost Insights: Breaking Down Union Pacific Corporation and Norfolk Southern Corporation's Expenses