| __timestamp | Paychex, Inc. | Union Pacific Corporation |
|---|---|---|
| Wednesday, January 1, 2014 | 1786400000 | 9677000000 |
| Thursday, January 1, 2015 | 1931600000 | 8976000000 |
| Friday, January 1, 2016 | 2094800000 | 8269000000 |
| Sunday, January 1, 2017 | 2231700000 | 9009000000 |
| Monday, January 1, 2018 | 2363100000 | 9539000000 |
| Tuesday, January 1, 2019 | 2594700000 | 9614000000 |
| Wednesday, January 1, 2020 | 2759700000 | 9179000000 |
| Friday, January 1, 2021 | 2785600000 | 10514000000 |
| Saturday, January 1, 2022 | 3255400000 | 11205000000 |
| Sunday, January 1, 2023 | 3554100000 | 10529000000 |
| Monday, January 1, 2024 | 3799000000 | 11039000000 |
In pursuit of knowledge
In the ever-evolving landscape of American business, Union Pacific Corporation and Paychex, Inc. stand as titans in their respective industries. From 2014 to 2024, these companies have demonstrated remarkable growth in gross profit, reflecting their resilience and strategic prowess.
Union Pacific, a leader in the transportation sector, has consistently maintained a robust gross profit, peaking in 2022 with a 12% increase from 2014. Despite a slight dip in 2023, the company rebounded in 2024, showcasing its ability to adapt to market fluctuations.
Paychex, a key player in the payroll and human resources services industry, has seen its gross profit soar by over 110% from 2014 to 2024. This impressive growth trajectory underscores Paychex's strategic expansion and innovation in service offerings.
Both companies exemplify the dynamic nature of American enterprise, each navigating their unique challenges and opportunities with strategic acumen.
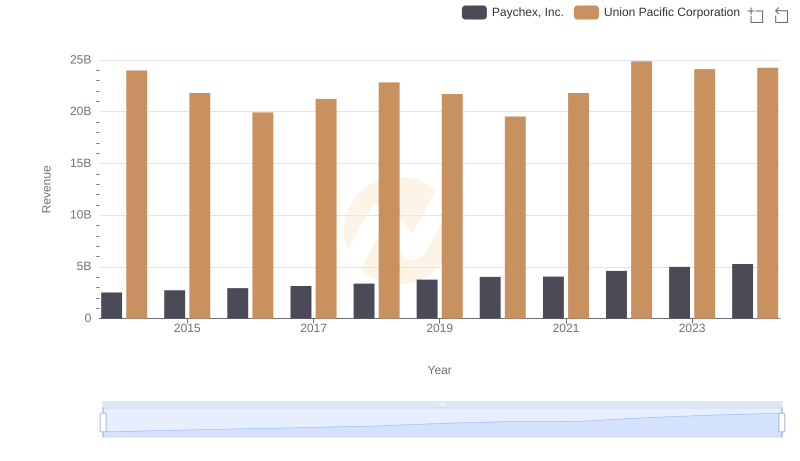
Breaking Down Revenue Trends: Union Pacific Corporation vs Paychex, Inc.
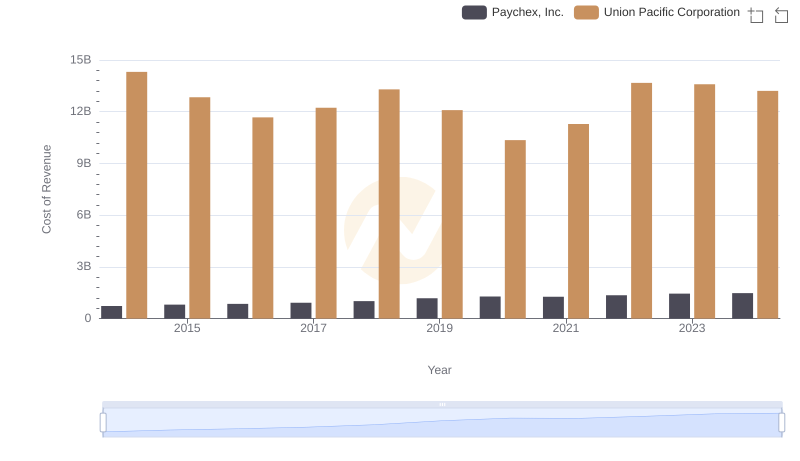
Analyzing Cost of Revenue: Union Pacific Corporation and Paychex, Inc.
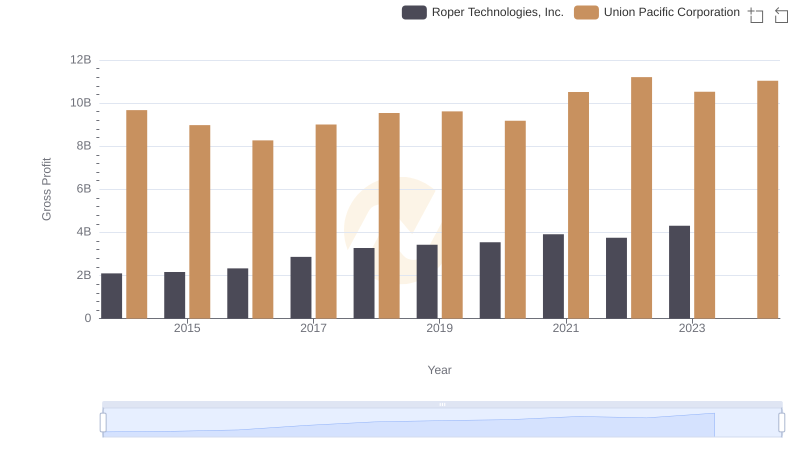
Who Generates Higher Gross Profit? Union Pacific Corporation or Roper Technologies, Inc.
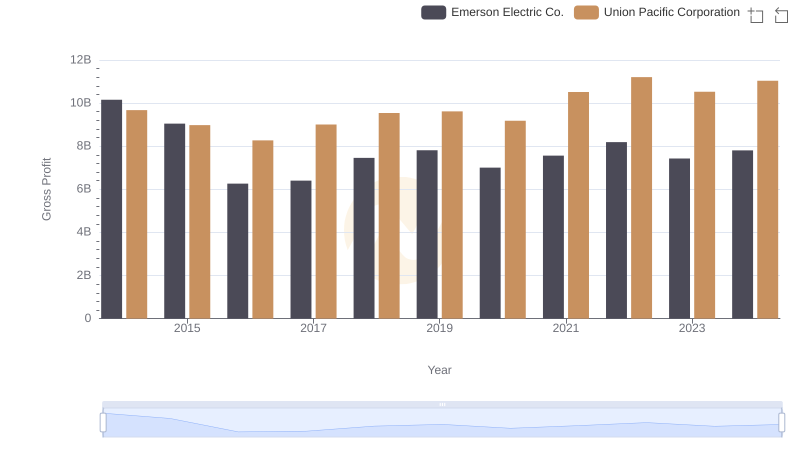
Union Pacific Corporation and Emerson Electric Co.: A Detailed Gross Profit Analysis
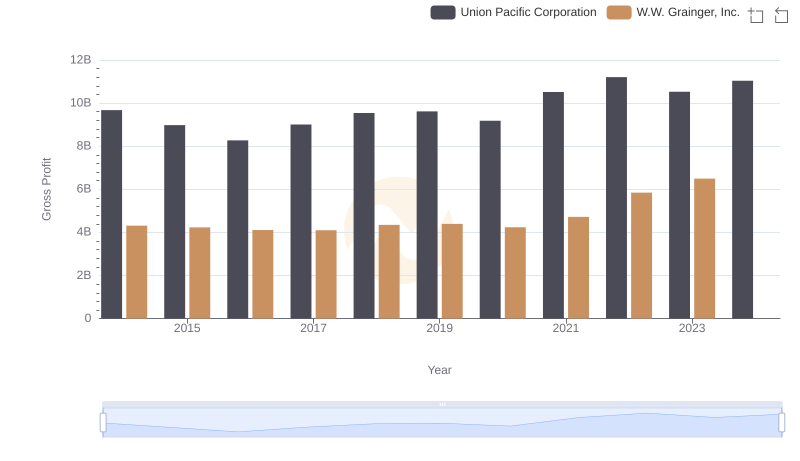
Union Pacific Corporation and W.W. Grainger, Inc.: A Detailed Gross Profit Analysis
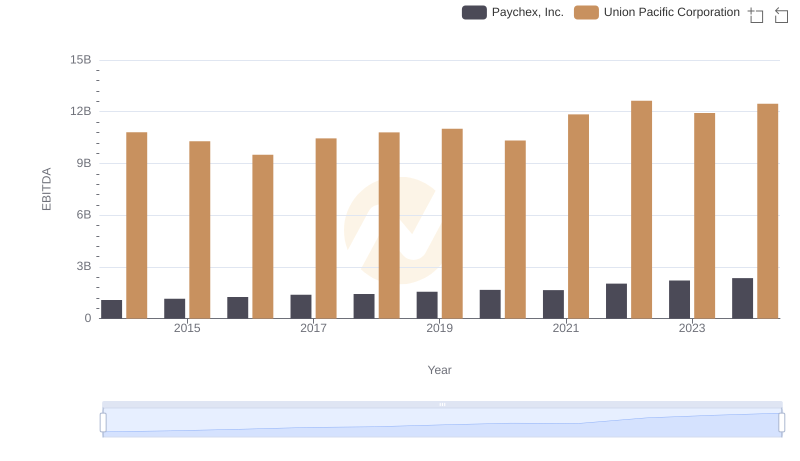
Union Pacific Corporation vs Paychex, Inc.: In-Depth EBITDA Performance Comparison