| __timestamp | AECOM | Global Payments Inc. |
|---|---|---|
| Wednesday, January 1, 2014 | 4855627000 | 2773718000 |
| Thursday, January 1, 2015 | 17989880000 | 2898150000 |
| Friday, January 1, 2016 | 17410825000 | 3370976000 |
| Sunday, January 1, 2017 | 18203402000 | 3975163000 |
| Monday, January 1, 2018 | 20155512000 | 3366366000 |
| Tuesday, January 1, 2019 | 20173329000 | 4911892000 |
| Wednesday, January 1, 2020 | 13239976000 | 7423558000 |
| Friday, January 1, 2021 | 13340852000 | 8523762000 |
| Saturday, January 1, 2022 | 13148182000 | 8975515000 |
| Sunday, January 1, 2023 | 14378461000 | 9654419000 |
| Monday, January 1, 2024 | 16105498000 | 10105894000 |
Cracking the code
In the ever-evolving landscape of global business, AECOM and Global Payments Inc. stand as titans in their respective fields. Over the past decade, AECOM, a leader in infrastructure and engineering services, has consistently outpaced Global Payments Inc., a key player in the financial technology sector, in terms of annual revenue. From 2014 to 2023, AECOM's revenue surged by approximately 230%, peaking in 2019 with a remarkable $20 billion. In contrast, Global Payments Inc. experienced a steady climb, with revenues increasing by nearly 250% over the same period, reaching a high of $9.7 billion in 2023.
Despite the missing data for 2024, the trend suggests a continued upward trajectory for both companies. This comparison not only highlights the robust growth of these industry leaders but also underscores the dynamic nature of global markets, where innovation and strategic expansion drive success.
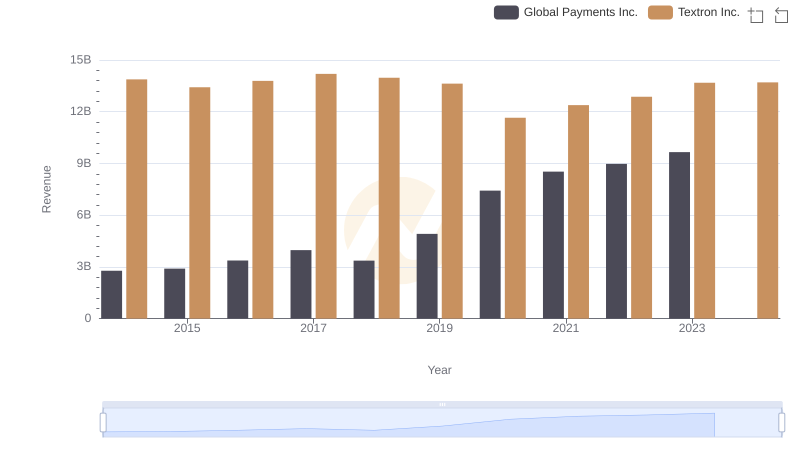
Global Payments Inc. and Textron Inc.: A Comprehensive Revenue Analysis
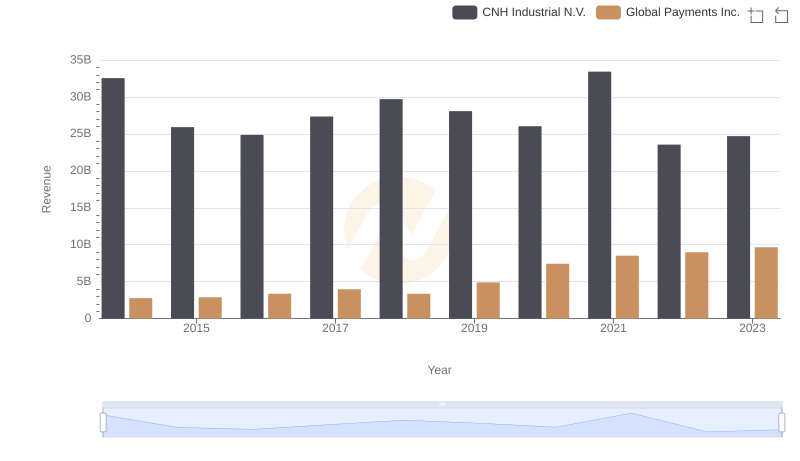
Revenue Insights: Global Payments Inc. and CNH Industrial N.V. Performance Compared
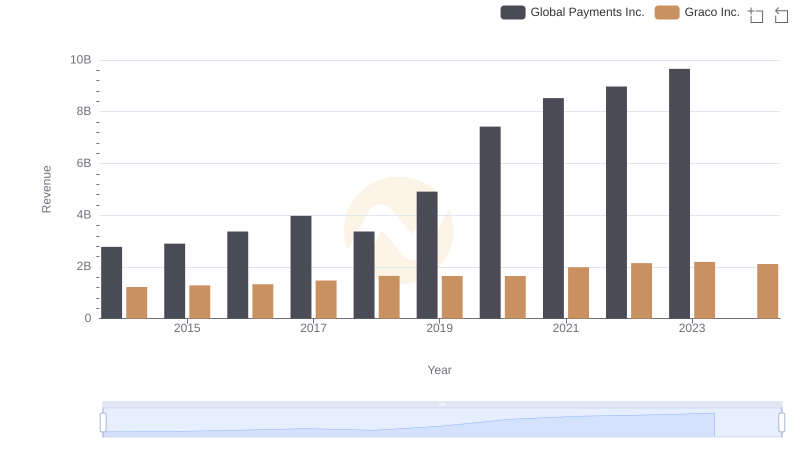
Revenue Showdown: Global Payments Inc. vs Graco Inc.
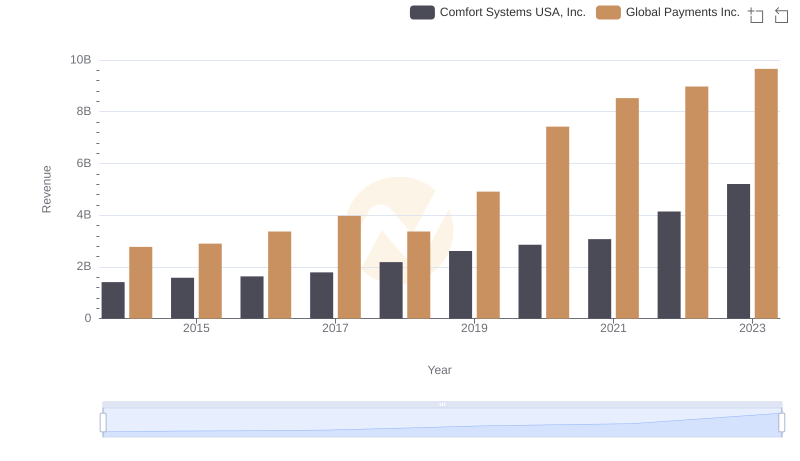
Revenue Insights: Global Payments Inc. and Comfort Systems USA, Inc. Performance Compared
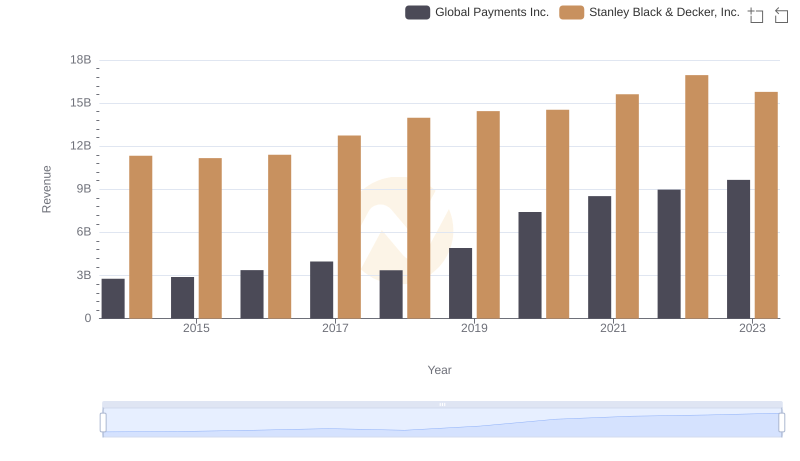
Revenue Insights: Global Payments Inc. and Stanley Black & Decker, Inc. Performance Compared
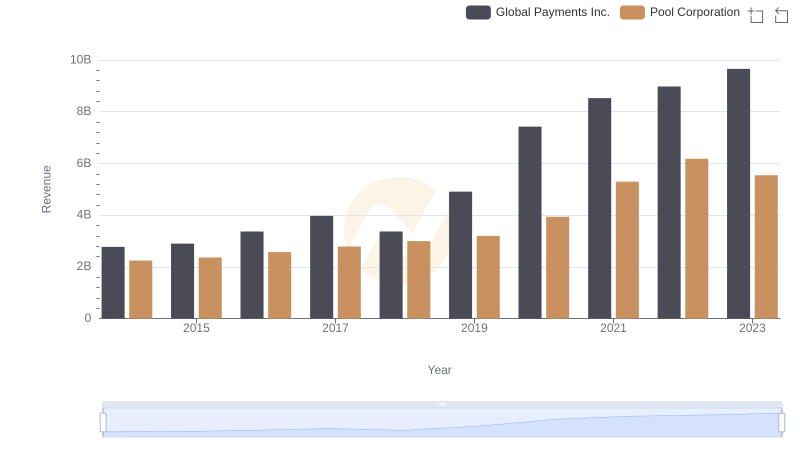
Revenue Showdown: Global Payments Inc. vs Pool Corporation

Comparing Cost of Revenue Efficiency: Global Payments Inc. vs AECOM
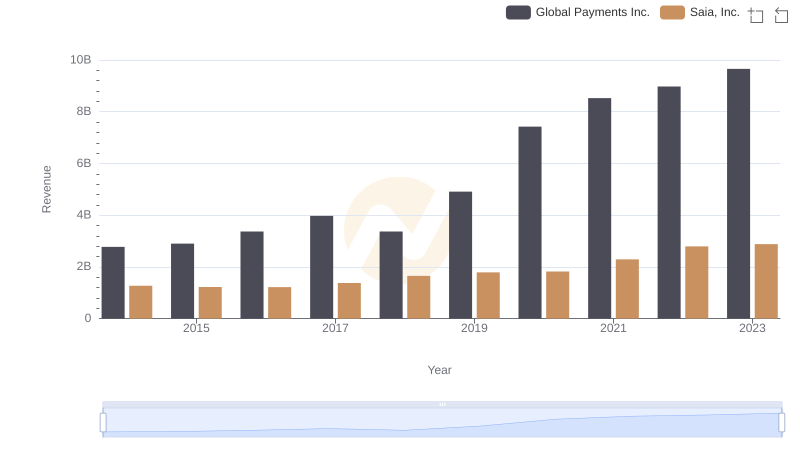
Global Payments Inc. and Saia, Inc.: A Comprehensive Revenue Analysis
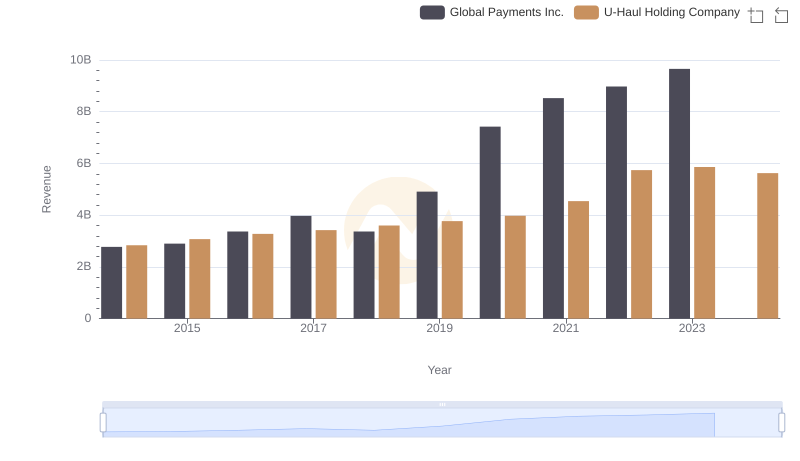
Comparing Revenue Performance: Global Payments Inc. or U-Haul Holding Company?
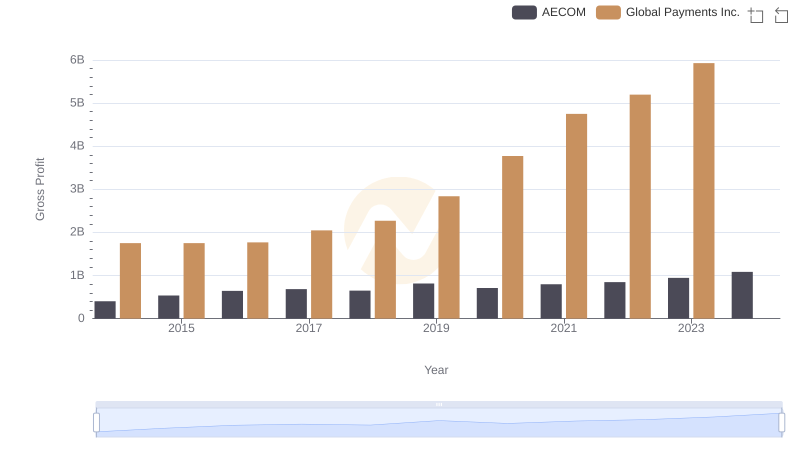
Global Payments Inc. and AECOM: A Detailed Gross Profit Analysis
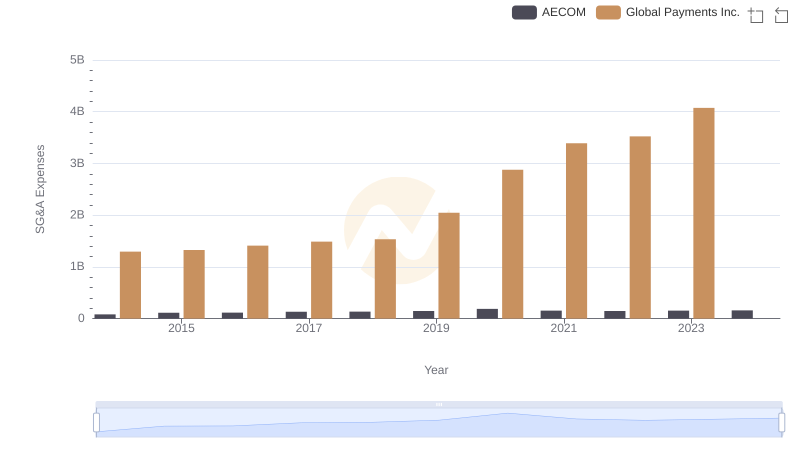
Global Payments Inc. and AECOM: SG&A Spending Patterns Compared
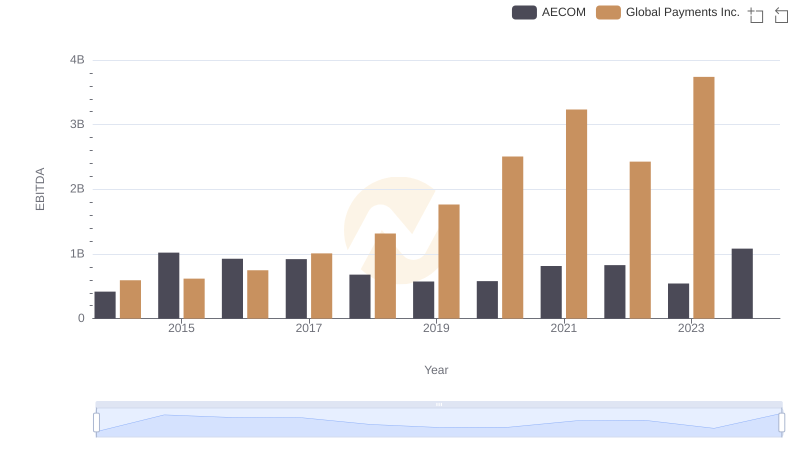
A Professional Review of EBITDA: Global Payments Inc. Compared to AECOM