| __timestamp | Global Payments Inc. | Pool Corporation |
|---|---|---|
| Wednesday, January 1, 2014 | 2773718000 | 2246562000 |
| Thursday, January 1, 2015 | 2898150000 | 2363139000 |
| Friday, January 1, 2016 | 3370976000 | 2570803000 |
| Sunday, January 1, 2017 | 3975163000 | 2788188000 |
| Monday, January 1, 2018 | 3366366000 | 2998097000 |
| Tuesday, January 1, 2019 | 4911892000 | 3199517000 |
| Wednesday, January 1, 2020 | 7423558000 | 3936623000 |
| Friday, January 1, 2021 | 8523762000 | 5295584000 |
| Saturday, January 1, 2022 | 8975515000 | 6179727000 |
| Sunday, January 1, 2023 | 9654419000 | 5541595000 |
| Monday, January 1, 2024 | 10105894000 |
Unleashing insights
In the ever-evolving landscape of global commerce, Global Payments Inc. and Pool Corporation have emerged as formidable players. Over the past decade, Global Payments Inc. has seen its revenue soar by an impressive 248%, starting from $2.77 billion in 2014 to a staggering $9.65 billion in 2023. This growth reflects the company's strategic expansions and innovations in payment solutions. Meanwhile, Pool Corporation, a leader in the pool and outdoor living industry, has also demonstrated robust growth, with its revenue increasing by 147% from $2.25 billion in 2014 to $5.54 billion in 2023. This steady rise underscores the growing demand for leisure and outdoor products. As these two giants continue to expand their market presence, their revenue trajectories offer a fascinating glimpse into the dynamics of their respective industries.
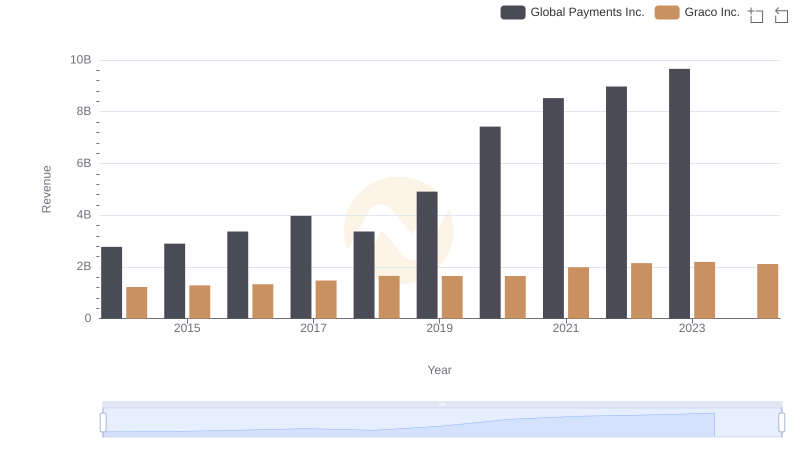
Revenue Showdown: Global Payments Inc. vs Graco Inc.
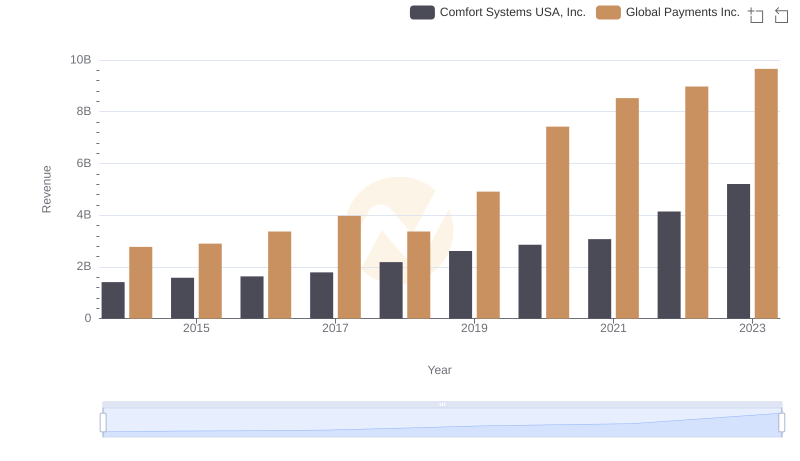
Revenue Insights: Global Payments Inc. and Comfort Systems USA, Inc. Performance Compared
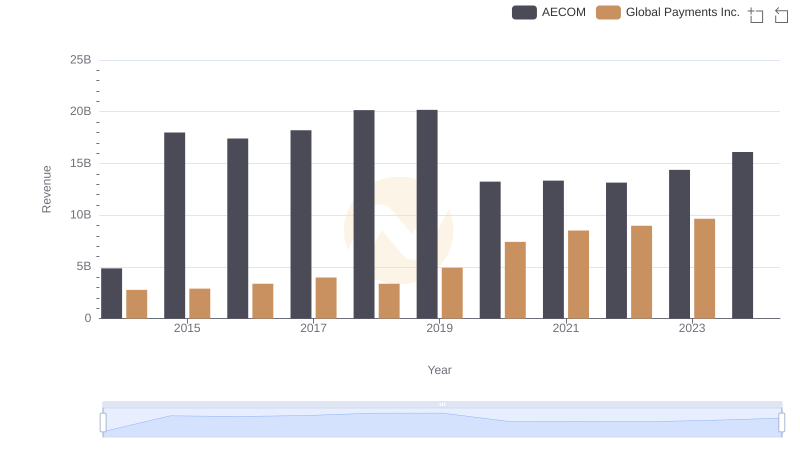
Annual Revenue Comparison: Global Payments Inc. vs AECOM
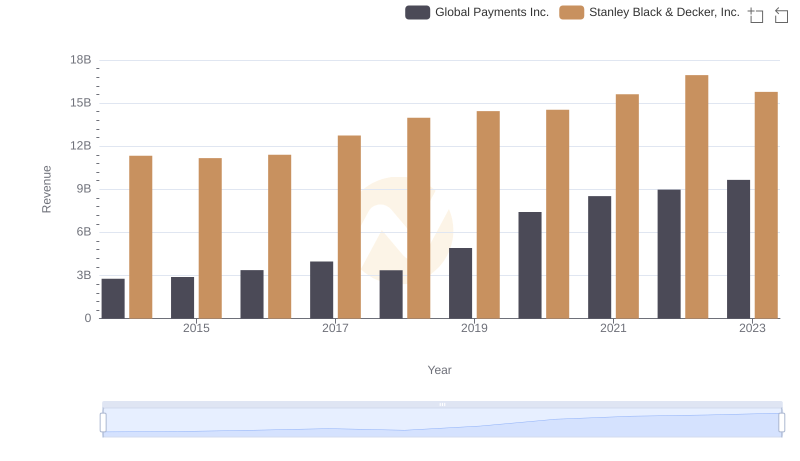
Revenue Insights: Global Payments Inc. and Stanley Black & Decker, Inc. Performance Compared
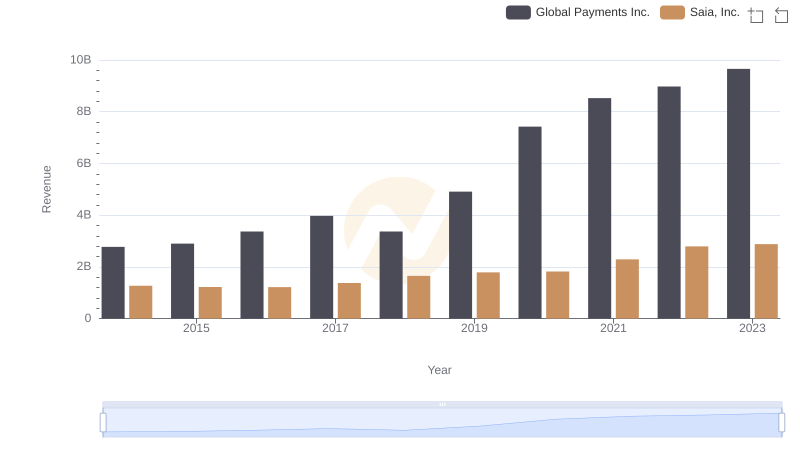
Global Payments Inc. and Saia, Inc.: A Comprehensive Revenue Analysis
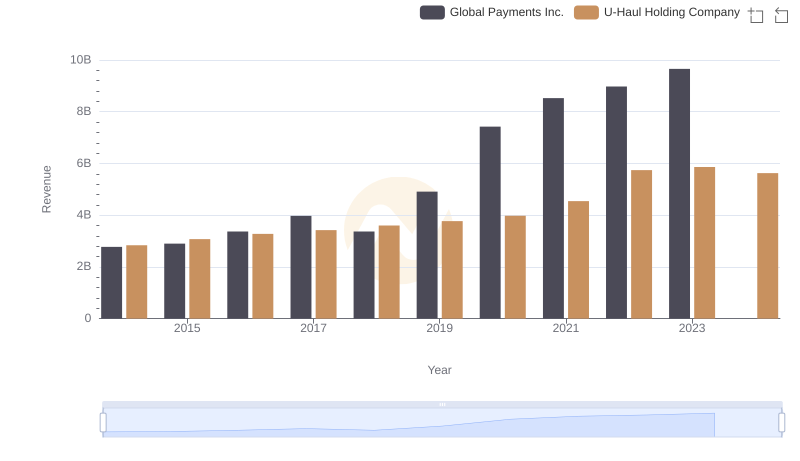
Comparing Revenue Performance: Global Payments Inc. or U-Haul Holding Company?
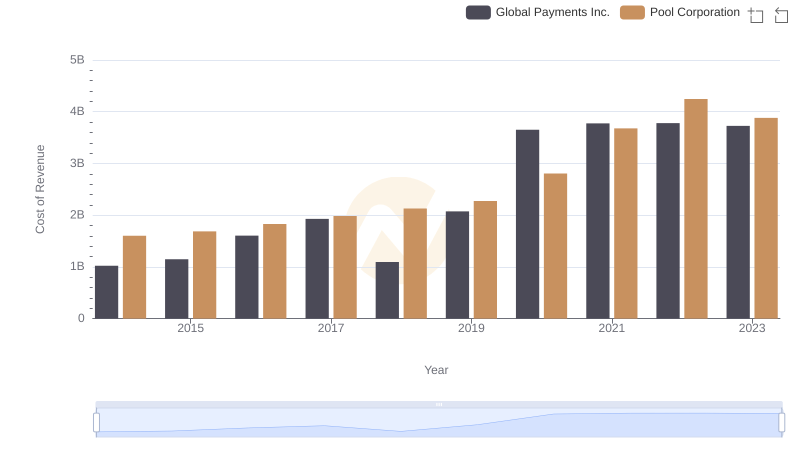
Global Payments Inc. vs Pool Corporation: Efficiency in Cost of Revenue Explored
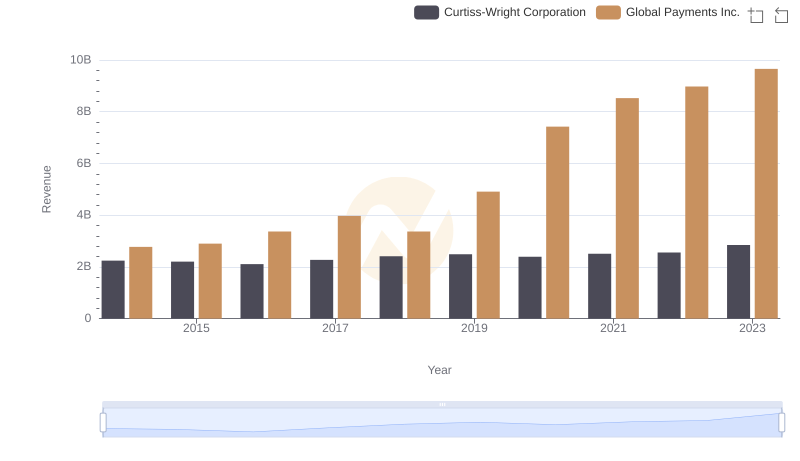
Annual Revenue Comparison: Global Payments Inc. vs Curtiss-Wright Corporation
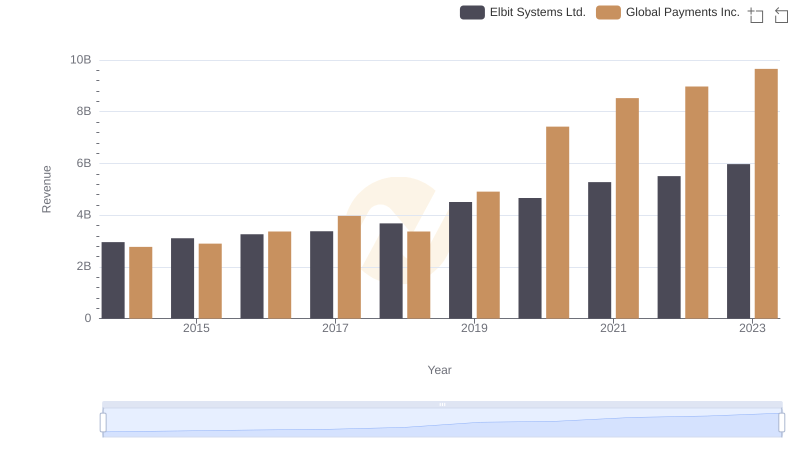
Global Payments Inc. vs Elbit Systems Ltd.: Annual Revenue Growth Compared

Key Insights on Gross Profit: Global Payments Inc. vs Pool Corporation
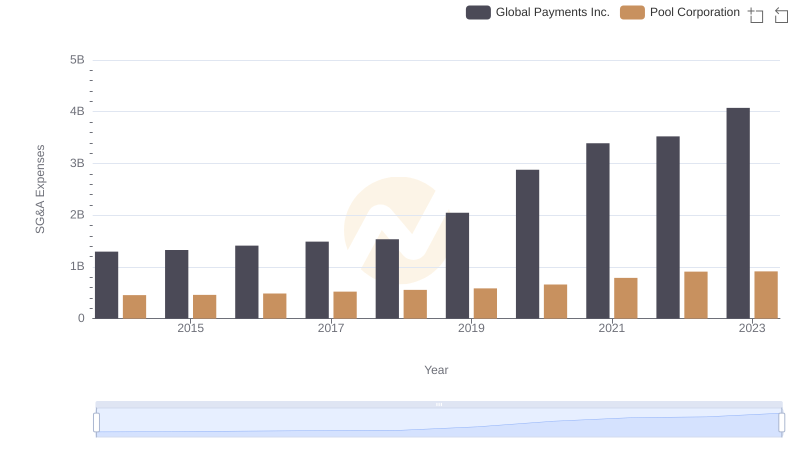
Comparing SG&A Expenses: Global Payments Inc. vs Pool Corporation Trends and Insights