| __timestamp | AECOM | Global Payments Inc. |
|---|---|---|
| Wednesday, January 1, 2014 | 80908000 | 1295014000 |
| Thursday, January 1, 2015 | 113975000 | 1325567000 |
| Friday, January 1, 2016 | 115088000 | 1411096000 |
| Sunday, January 1, 2017 | 133309000 | 1488258000 |
| Monday, January 1, 2018 | 135787000 | 1534297000 |
| Tuesday, January 1, 2019 | 148123000 | 2046672000 |
| Wednesday, January 1, 2020 | 188535000 | 2878878000 |
| Friday, January 1, 2021 | 155072000 | 3391161000 |
| Saturday, January 1, 2022 | 147309000 | 3524578000 |
| Sunday, January 1, 2023 | 153575000 | 4073768000 |
| Monday, January 1, 2024 | 160105000 | 4285307000 |
Unleashing insights
In the ever-evolving landscape of corporate finance, understanding the spending patterns of industry giants can offer valuable insights. AECOM and Global Payments Inc., two leaders in their respective fields, have shown distinct trends in their Selling, General, and Administrative (SG&A) expenses over the past decade.
From 2014 to 2023, AECOM's SG&A expenses have seen a gradual increase, starting at approximately $81 million and reaching around $160 million by 2024. This represents a near doubling of their spending, reflecting strategic investments in operational efficiency and market expansion.
In contrast, Global Payments Inc. has experienced a more dramatic rise. Their SG&A expenses surged from $1.3 billion in 2014 to over $4 billion by 2023, marking a staggering 200% increase. This growth underscores their aggressive expansion and adaptation to the digital payment revolution.
While AECOM's data for 2024 is available, Global Payments Inc.'s figures remain elusive, leaving room for speculation on their future trajectory.
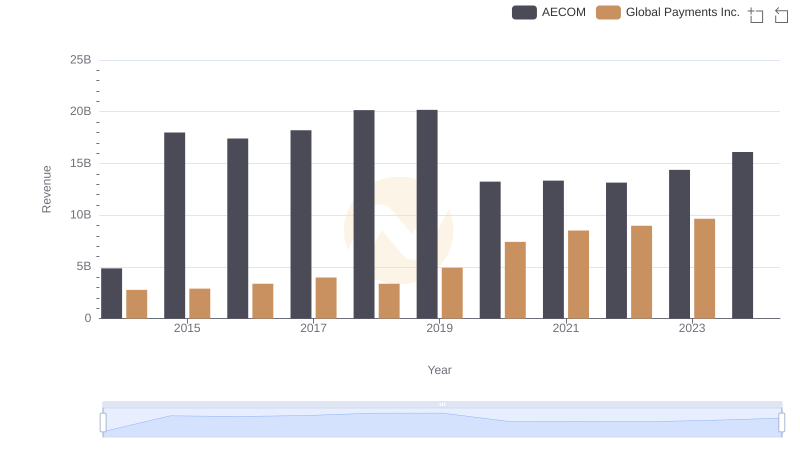
Annual Revenue Comparison: Global Payments Inc. vs AECOM

Comparing Cost of Revenue Efficiency: Global Payments Inc. vs AECOM
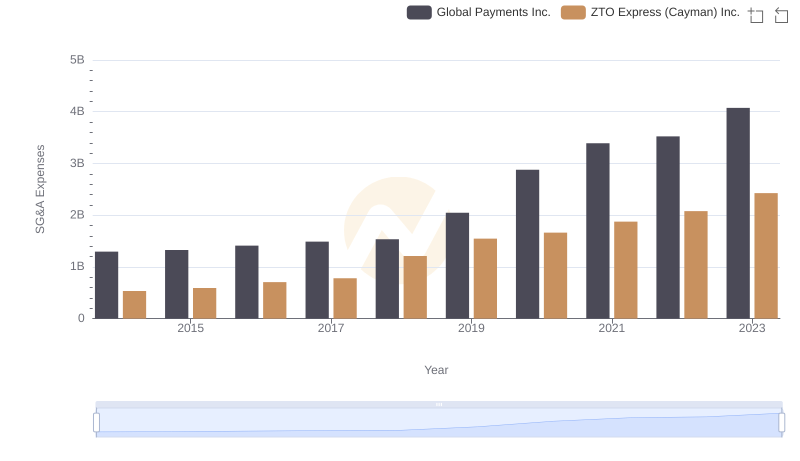
Selling, General, and Administrative Costs: Global Payments Inc. vs ZTO Express (Cayman) Inc.
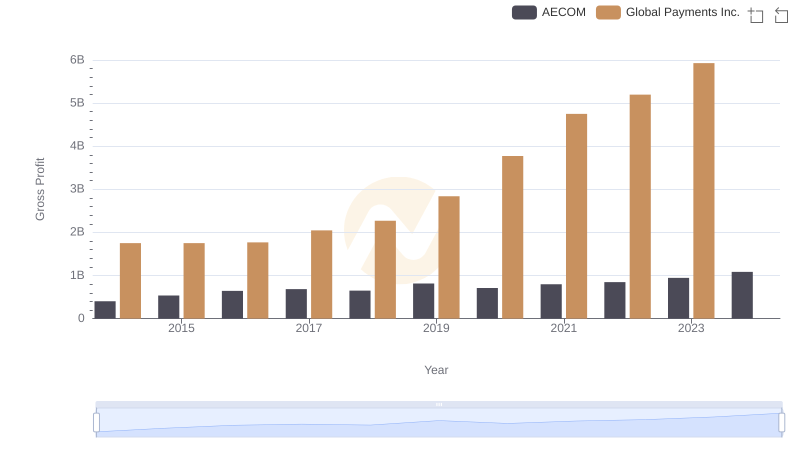
Global Payments Inc. and AECOM: A Detailed Gross Profit Analysis
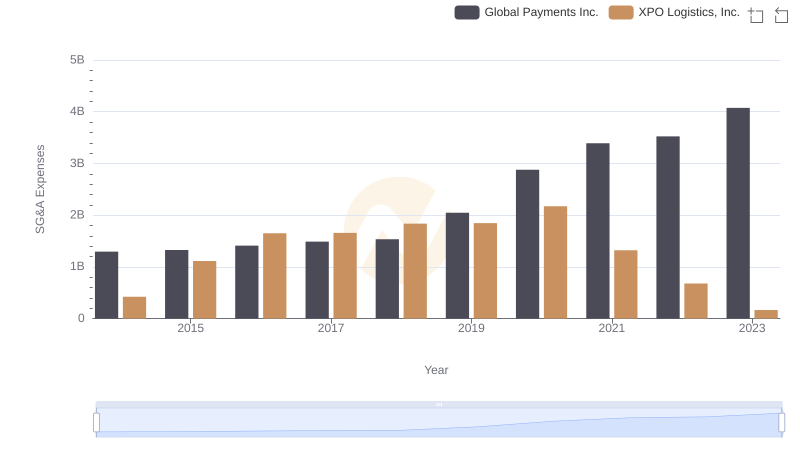
SG&A Efficiency Analysis: Comparing Global Payments Inc. and XPO Logistics, Inc.
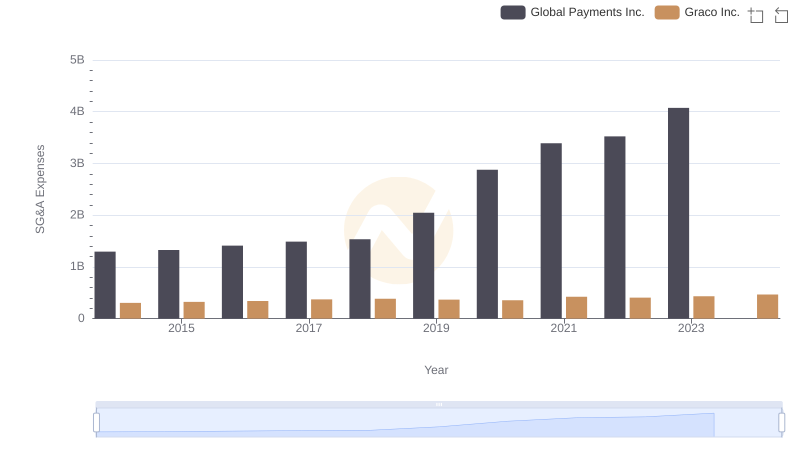
Global Payments Inc. vs Graco Inc.: SG&A Expense Trends
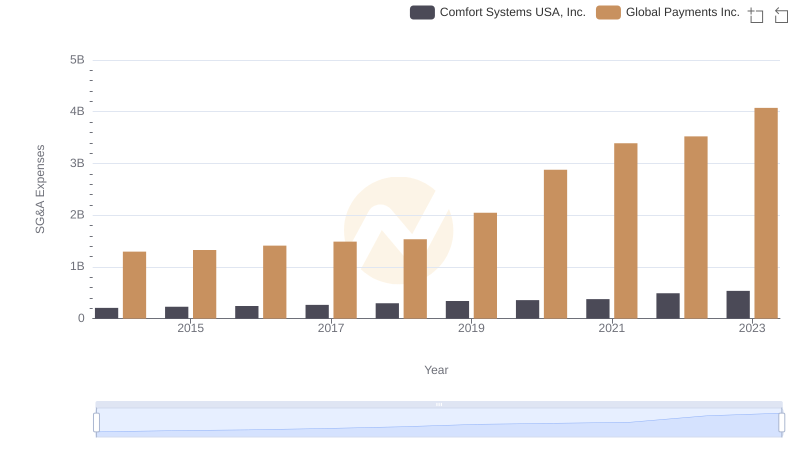
Selling, General, and Administrative Costs: Global Payments Inc. vs Comfort Systems USA, Inc.
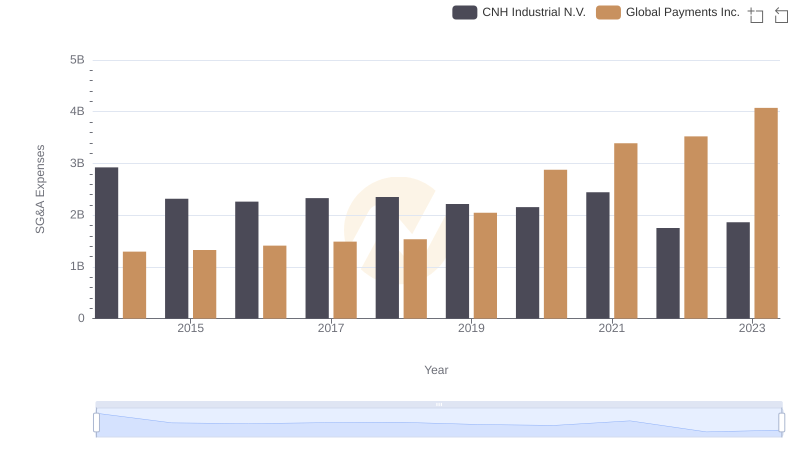
Global Payments Inc. or CNH Industrial N.V.: Who Manages SG&A Costs Better?
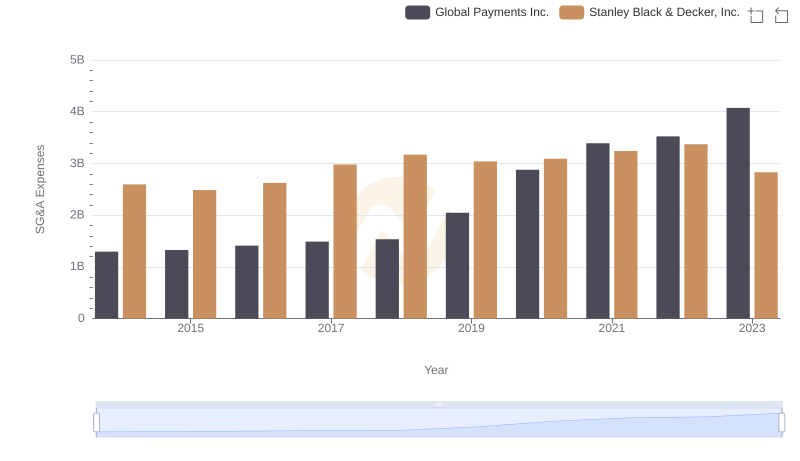
Breaking Down SG&A Expenses: Global Payments Inc. vs Stanley Black & Decker, Inc.
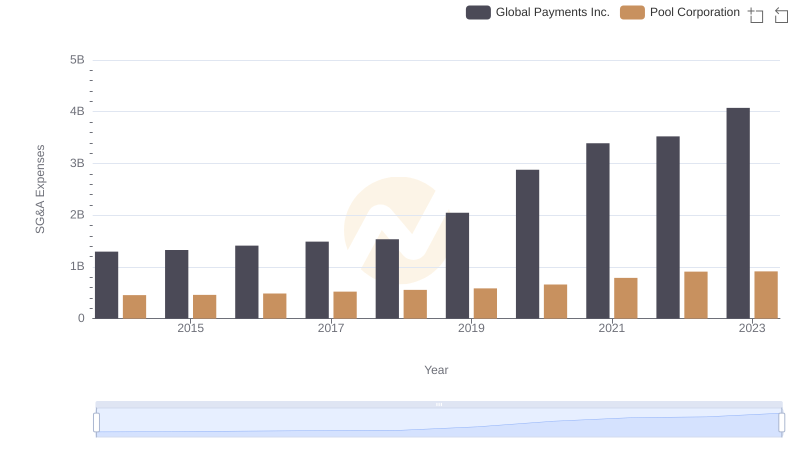
Comparing SG&A Expenses: Global Payments Inc. vs Pool Corporation Trends and Insights
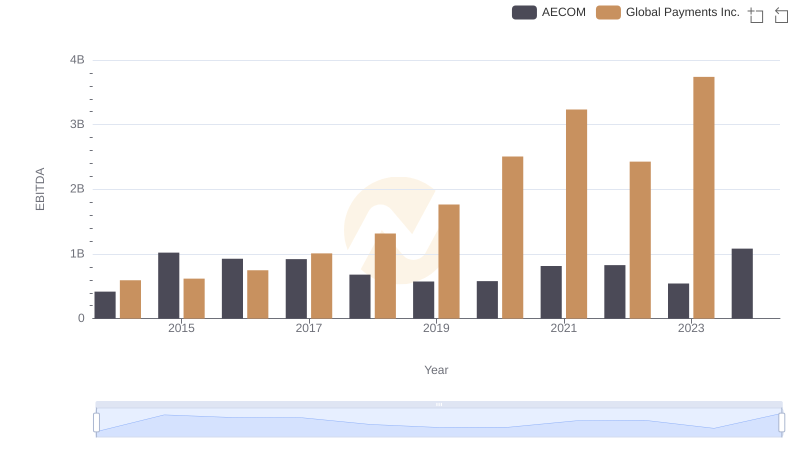
A Professional Review of EBITDA: Global Payments Inc. Compared to AECOM