| __timestamp | Comfort Systems USA, Inc. | Global Payments Inc. |
|---|---|---|
| Wednesday, January 1, 2014 | 1410795000 | 2773718000 |
| Thursday, January 1, 2015 | 1580519000 | 2898150000 |
| Friday, January 1, 2016 | 1634340000 | 3370976000 |
| Sunday, January 1, 2017 | 1787922000 | 3975163000 |
| Monday, January 1, 2018 | 2182879000 | 3366366000 |
| Tuesday, January 1, 2019 | 2615277000 | 4911892000 |
| Wednesday, January 1, 2020 | 2856659000 | 7423558000 |
| Friday, January 1, 2021 | 3073636000 | 8523762000 |
| Saturday, January 1, 2022 | 4140364000 | 8975515000 |
| Sunday, January 1, 2023 | 5206760000 | 9654419000 |
| Monday, January 1, 2024 | 10105894000 |
Infusing magic into the data realm
In the ever-evolving landscape of the U.S. stock market, Global Payments Inc. and Comfort Systems USA, Inc. have demonstrated remarkable revenue trajectories over the past decade. From 2014 to 2023, Global Payments Inc. has seen its revenue soar by approximately 248%, reaching a peak in 2023. This growth underscores the company's strategic expansion and adaptation in the global payments industry.
Conversely, Comfort Systems USA, Inc., a leader in mechanical systems installation, has experienced a robust revenue increase of around 269% during the same period. This growth reflects the company's resilience and ability to capitalize on the increasing demand for HVAC services across the United States.
Both companies have shown consistent upward trends, with Global Payments Inc. maintaining a higher revenue base. This comparison highlights the diverse opportunities and challenges within different sectors of the economy, offering valuable insights for investors and market analysts alike.
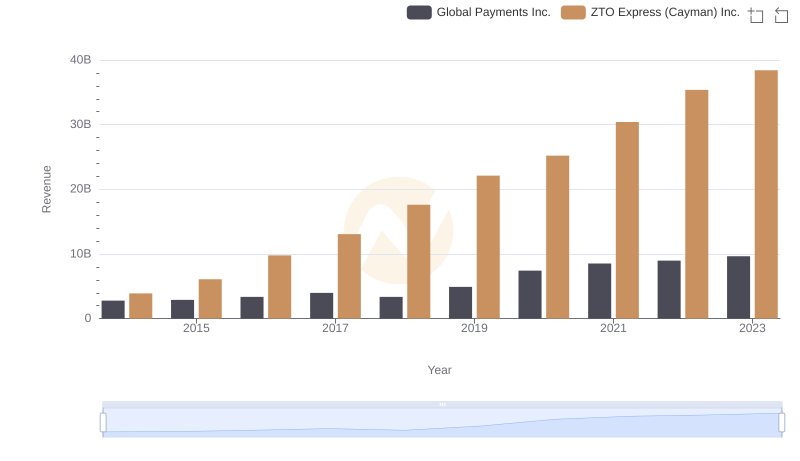
Who Generates More Revenue? Global Payments Inc. or ZTO Express (Cayman) Inc.
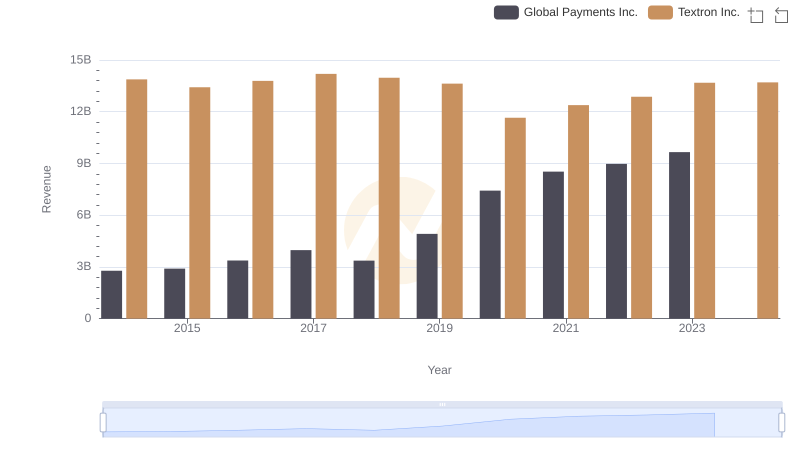
Global Payments Inc. and Textron Inc.: A Comprehensive Revenue Analysis
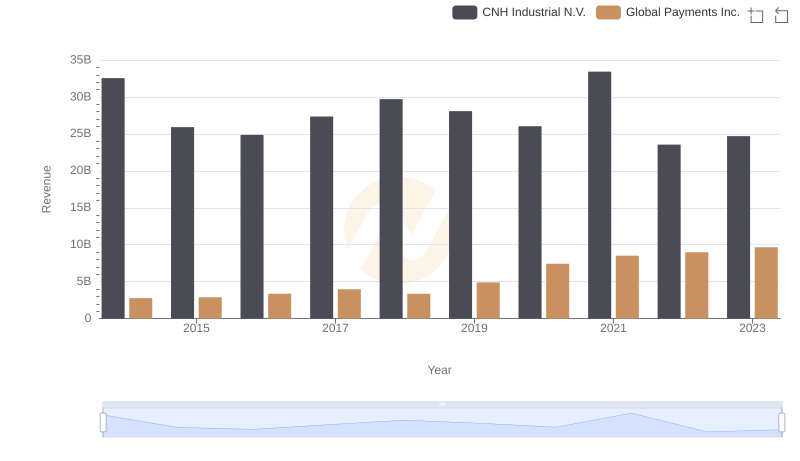
Revenue Insights: Global Payments Inc. and CNH Industrial N.V. Performance Compared
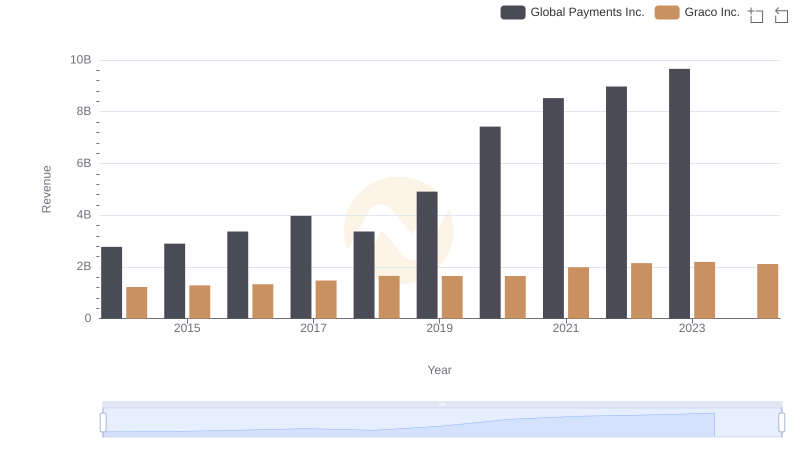
Revenue Showdown: Global Payments Inc. vs Graco Inc.
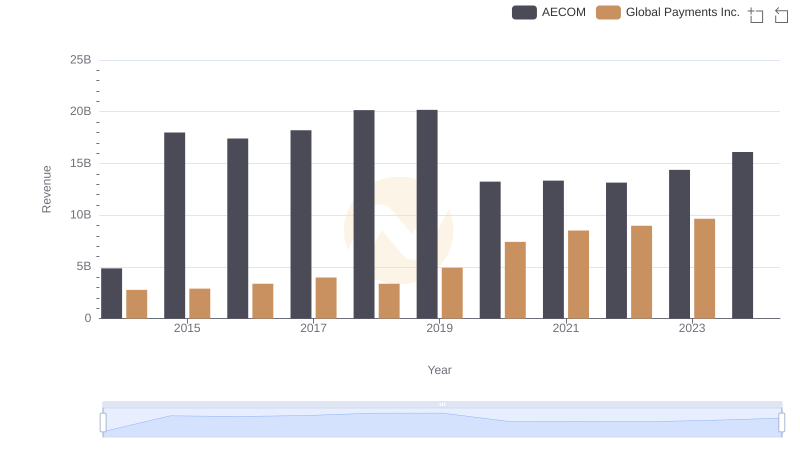
Annual Revenue Comparison: Global Payments Inc. vs AECOM
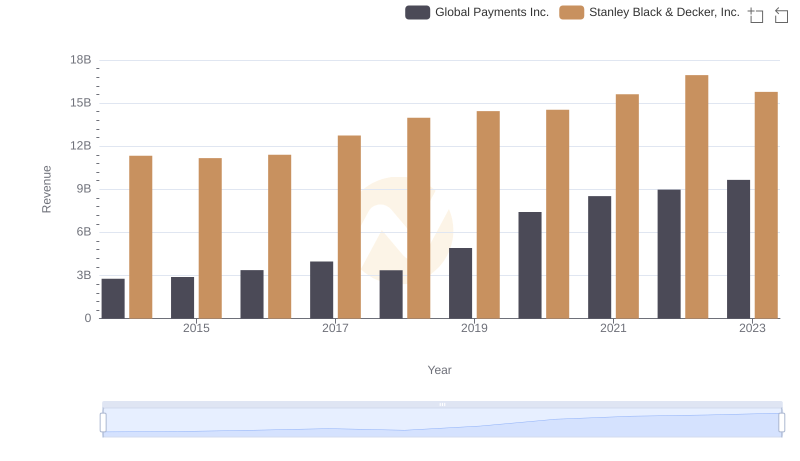
Revenue Insights: Global Payments Inc. and Stanley Black & Decker, Inc. Performance Compared
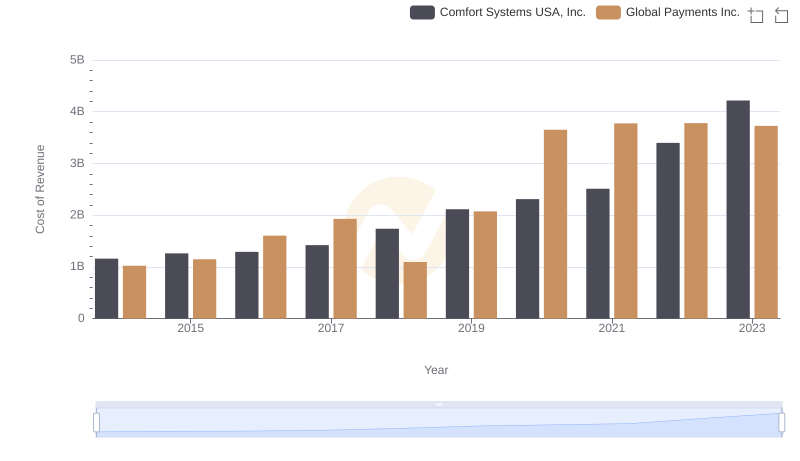
Comparing Cost of Revenue Efficiency: Global Payments Inc. vs Comfort Systems USA, Inc.
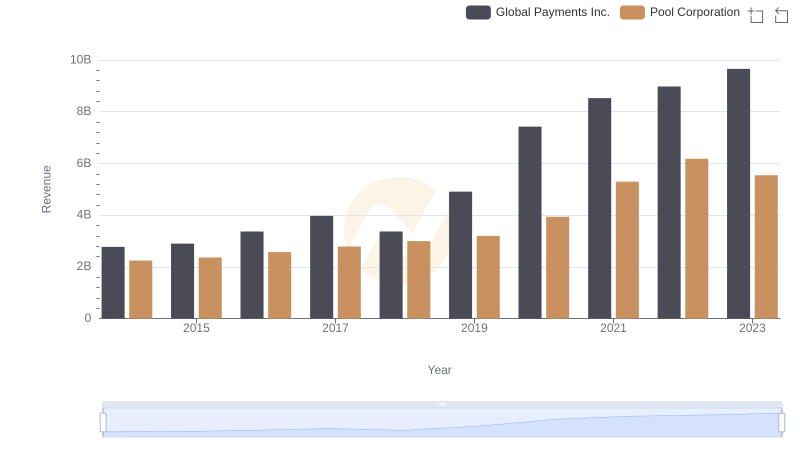
Revenue Showdown: Global Payments Inc. vs Pool Corporation
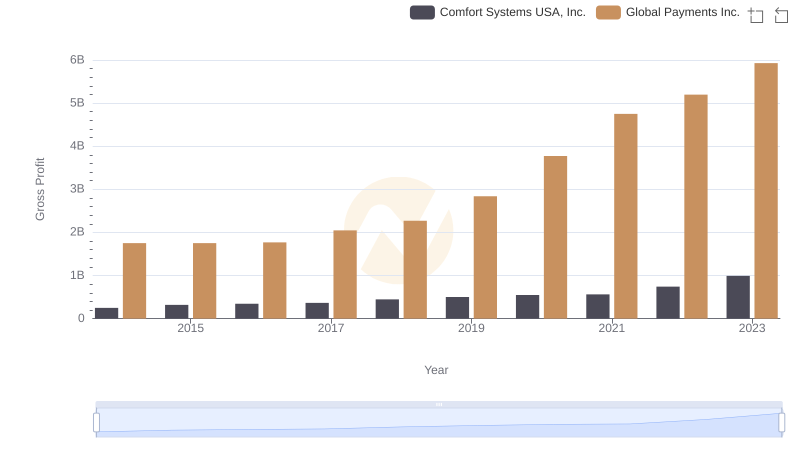
Who Generates Higher Gross Profit? Global Payments Inc. or Comfort Systems USA, Inc.
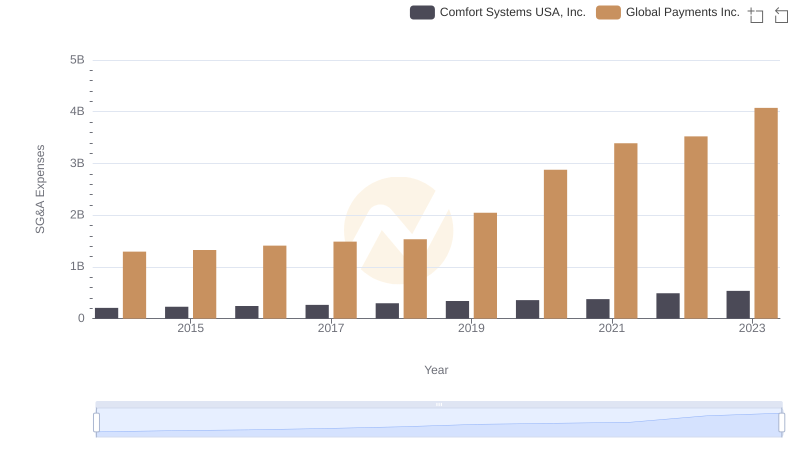
Selling, General, and Administrative Costs: Global Payments Inc. vs Comfort Systems USA, Inc.
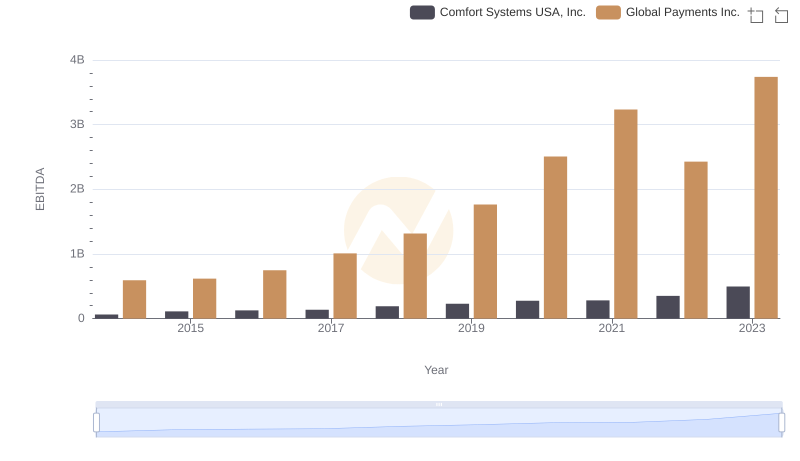
A Side-by-Side Analysis of EBITDA: Global Payments Inc. and Comfort Systems USA, Inc.