| __timestamp | Global Payments Inc. | Graco Inc. |
|---|---|---|
| Wednesday, January 1, 2014 | 2773718000 | 1221130000 |
| Thursday, January 1, 2015 | 2898150000 | 1286485000 |
| Friday, January 1, 2016 | 3370976000 | 1329293000 |
| Sunday, January 1, 2017 | 3975163000 | 1474744000 |
| Monday, January 1, 2018 | 3366366000 | 1653292000 |
| Tuesday, January 1, 2019 | 4911892000 | 1646045000 |
| Wednesday, January 1, 2020 | 7423558000 | 1650115000 |
| Friday, January 1, 2021 | 8523762000 | 1987608000 |
| Saturday, January 1, 2022 | 8975515000 | 2143521000 |
| Sunday, January 1, 2023 | 9654419000 | 2195606000 |
| Monday, January 1, 2024 | 10105894000 | 2113316000 |
Unleashing the power of data
In the ever-evolving landscape of global commerce, Global Payments Inc. and Graco Inc. have emerged as formidable players. Over the past decade, Global Payments Inc. has seen its revenue soar by an impressive 248%, from approximately $2.8 billion in 2014 to nearly $9.7 billion in 2023. This growth underscores its strategic prowess in the financial technology sector. Meanwhile, Graco Inc., a stalwart in the manufacturing industry, has demonstrated steady growth, with its revenue increasing by 80% over the same period, reaching over $2.1 billion in 2023.
While Global Payments Inc. experienced a meteoric rise, Graco Inc.'s consistent performance highlights its resilience and adaptability. The data from 2024 is incomplete, but the trends suggest continued growth for both companies. This revenue showdown not only reflects their individual successes but also the dynamic nature of their respective industries.
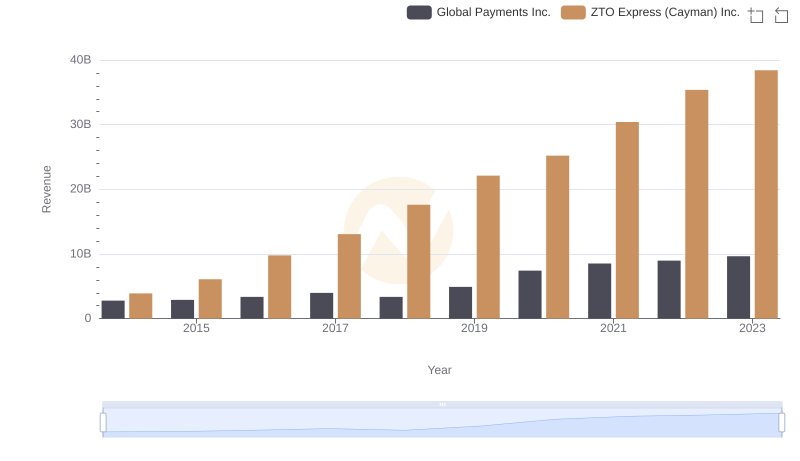
Who Generates More Revenue? Global Payments Inc. or ZTO Express (Cayman) Inc.
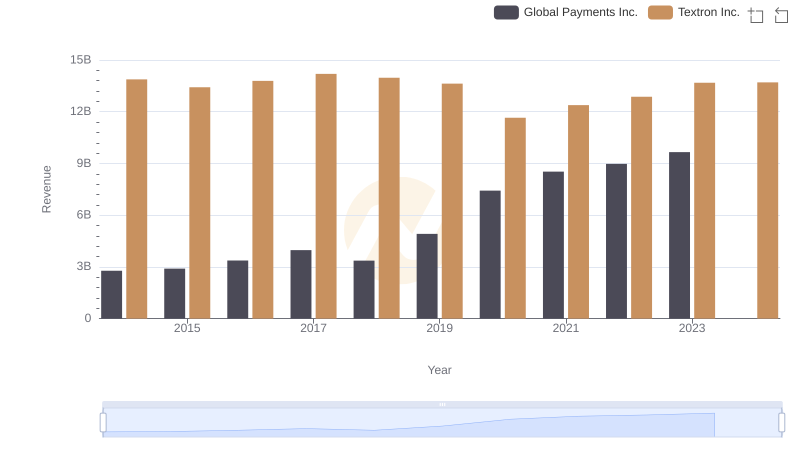
Global Payments Inc. and Textron Inc.: A Comprehensive Revenue Analysis
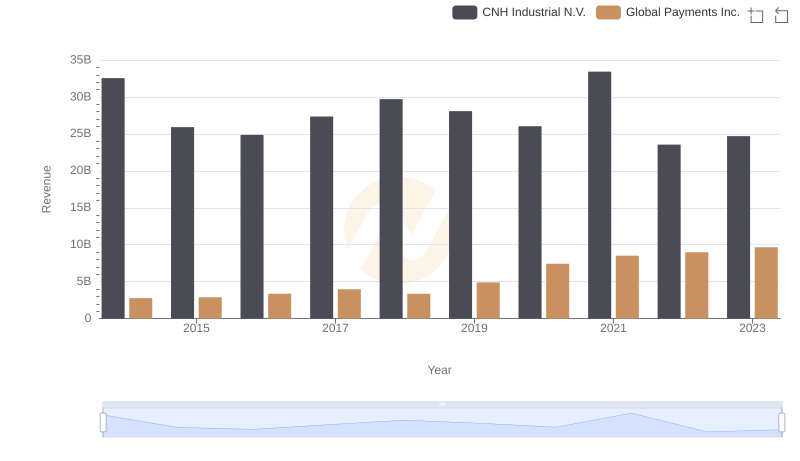
Revenue Insights: Global Payments Inc. and CNH Industrial N.V. Performance Compared
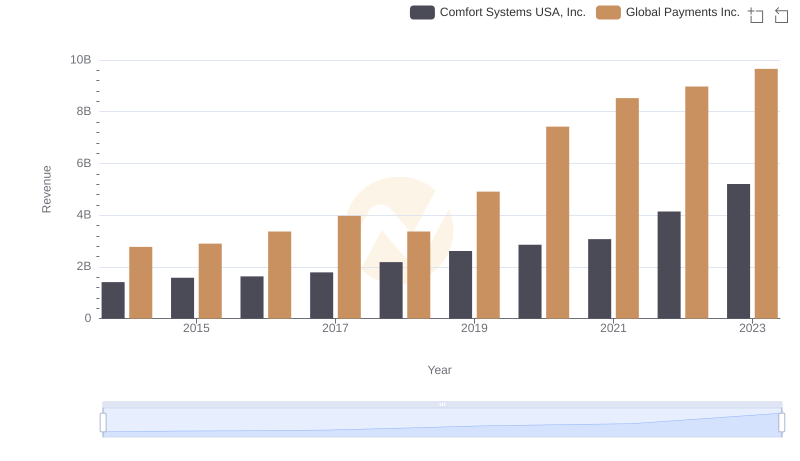
Revenue Insights: Global Payments Inc. and Comfort Systems USA, Inc. Performance Compared
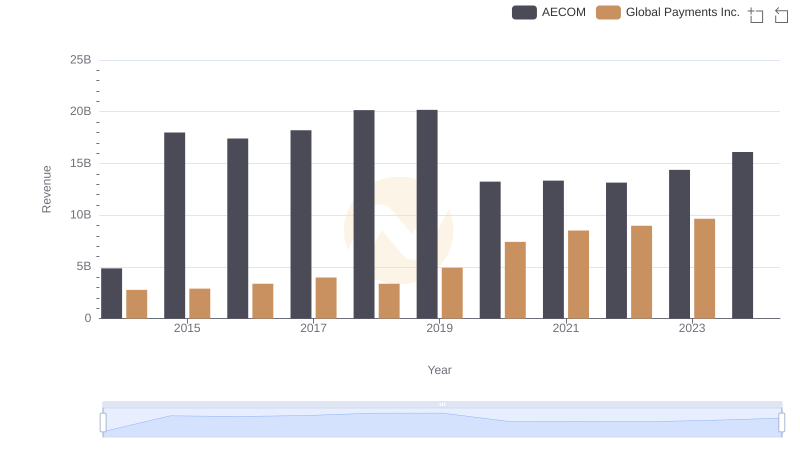
Annual Revenue Comparison: Global Payments Inc. vs AECOM
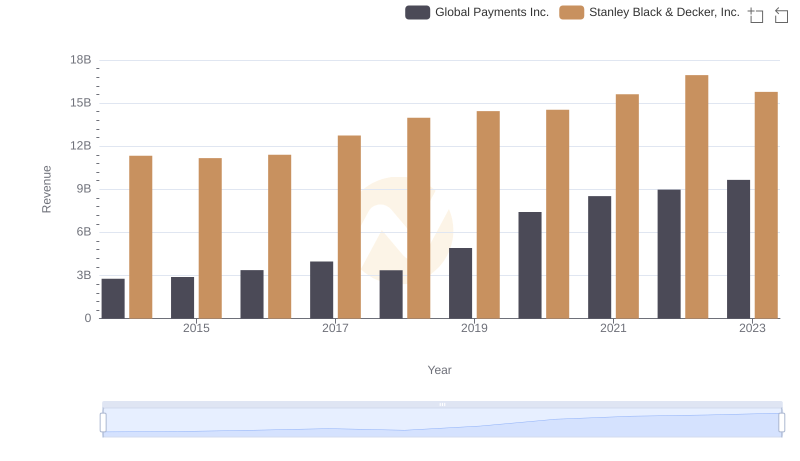
Revenue Insights: Global Payments Inc. and Stanley Black & Decker, Inc. Performance Compared
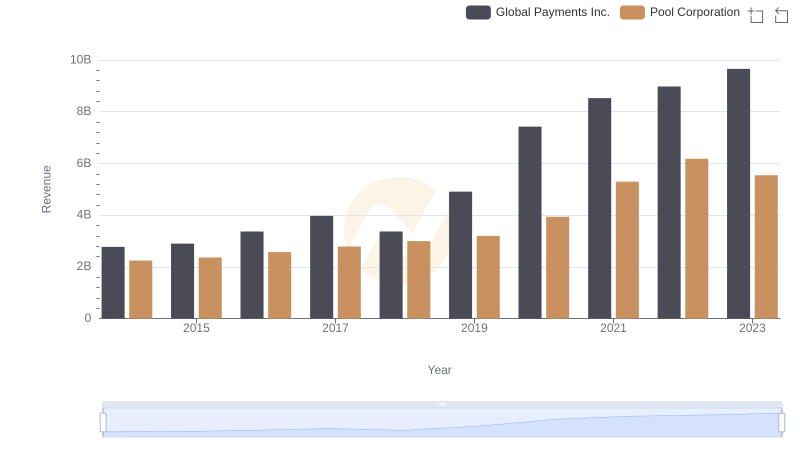
Revenue Showdown: Global Payments Inc. vs Pool Corporation
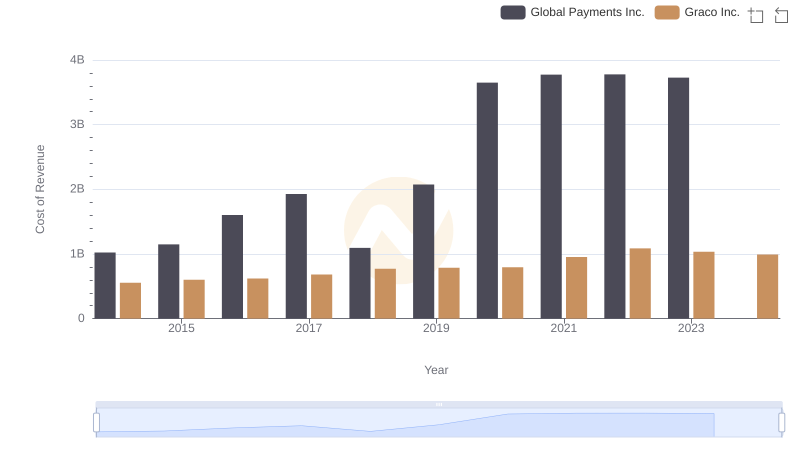
Analyzing Cost of Revenue: Global Payments Inc. and Graco Inc.
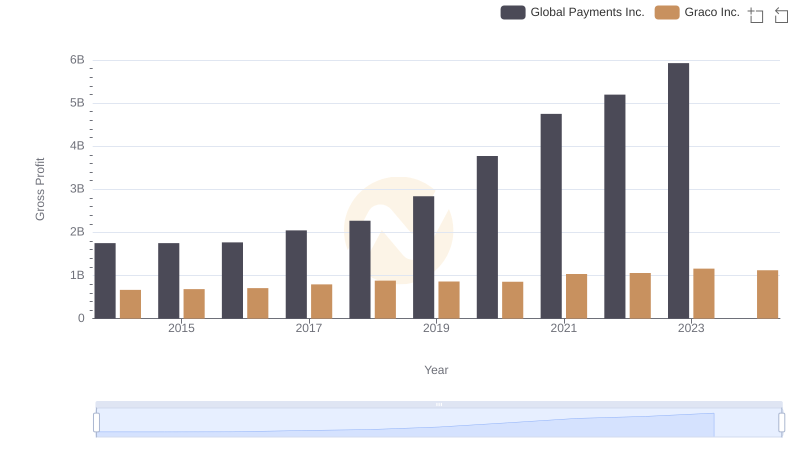
Gross Profit Comparison: Global Payments Inc. and Graco Inc. Trends
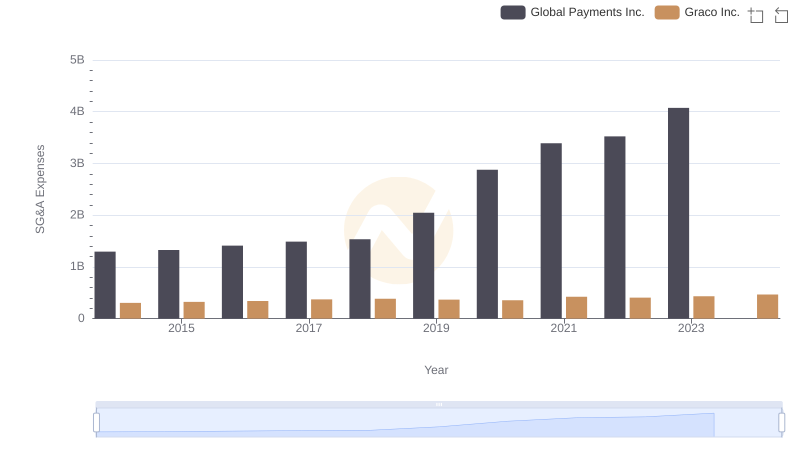
Global Payments Inc. vs Graco Inc.: SG&A Expense Trends
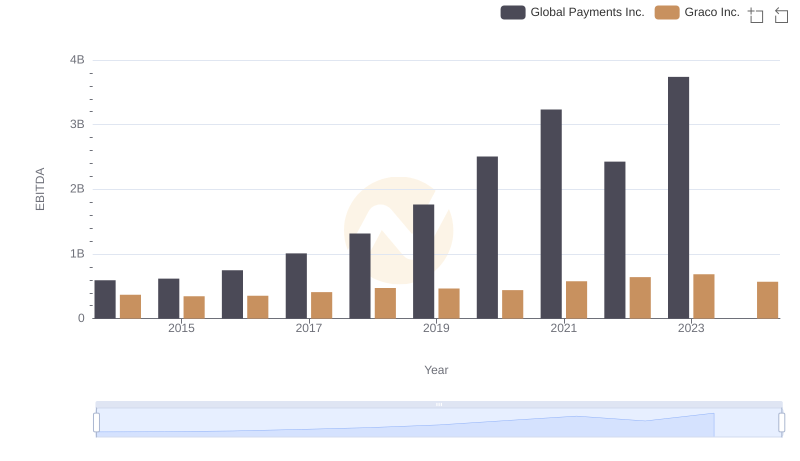
A Side-by-Side Analysis of EBITDA: Global Payments Inc. and Graco Inc.