| __timestamp | AECOM | Global Payments Inc. |
|---|---|---|
| Wednesday, January 1, 2014 | 4452451000 | 1022107000 |
| Thursday, January 1, 2015 | 17454692000 | 1147639000 |
| Friday, January 1, 2016 | 16768001000 | 1603532000 |
| Sunday, January 1, 2017 | 17519682000 | 1928037000 |
| Monday, January 1, 2018 | 19504863000 | 1095014000 |
| Tuesday, January 1, 2019 | 19359884000 | 2073803000 |
| Wednesday, January 1, 2020 | 12530416000 | 3650727000 |
| Friday, January 1, 2021 | 12542431000 | 3773725000 |
| Saturday, January 1, 2022 | 12300208000 | 3778617000 |
| Sunday, January 1, 2023 | 13432996000 | 3727521000 |
| Monday, January 1, 2024 | 15021157000 | 3760116000 |
Igniting the spark of knowledge
In the ever-evolving landscape of corporate finance, understanding cost efficiency is paramount. AECOM and Global Payments Inc., two giants in their respective fields, offer a fascinating study in contrasts. From 2014 to 2023, AECOM's cost of revenue has shown a robust upward trend, peaking at approximately $19.5 billion in 2018. This represents a staggering 338% increase from its 2014 figures. In contrast, Global Payments Inc. has maintained a more modest growth trajectory, with its cost of revenue increasing by about 266% over the same period, reaching a high of nearly $3.8 billion in 2022.
The data reveals a compelling narrative of strategic financial management. While AECOM's costs have fluctuated, Global Payments Inc. has demonstrated consistent growth, albeit with some missing data in 2024. This comparison underscores the diverse strategies companies employ to manage their cost structures effectively.
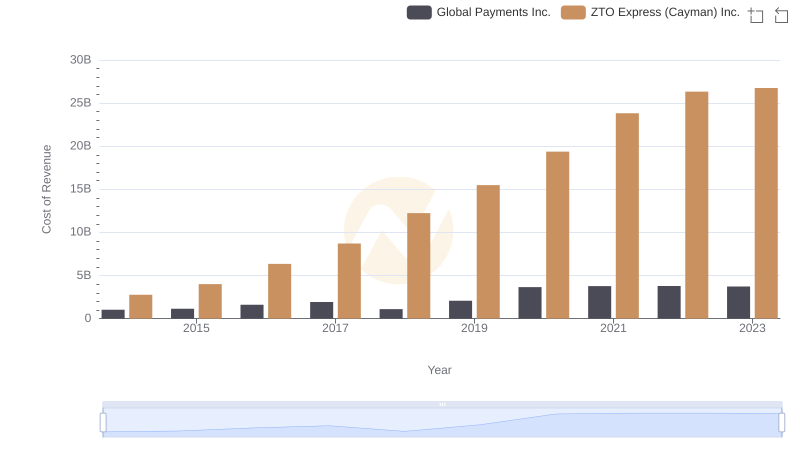
Analyzing Cost of Revenue: Global Payments Inc. and ZTO Express (Cayman) Inc.
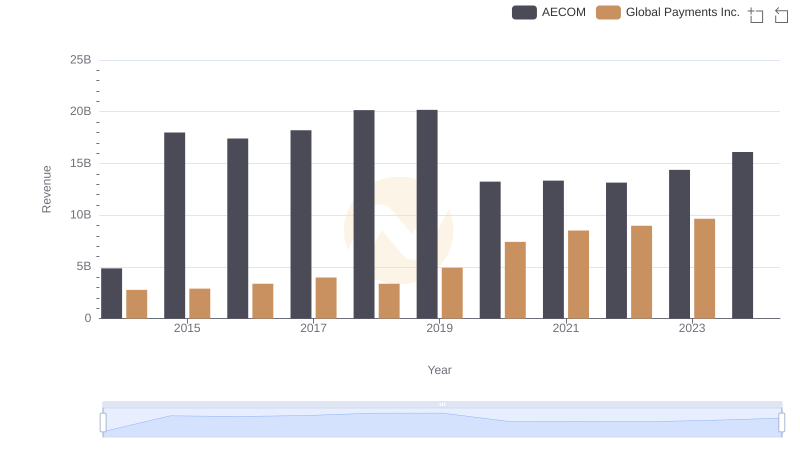
Annual Revenue Comparison: Global Payments Inc. vs AECOM
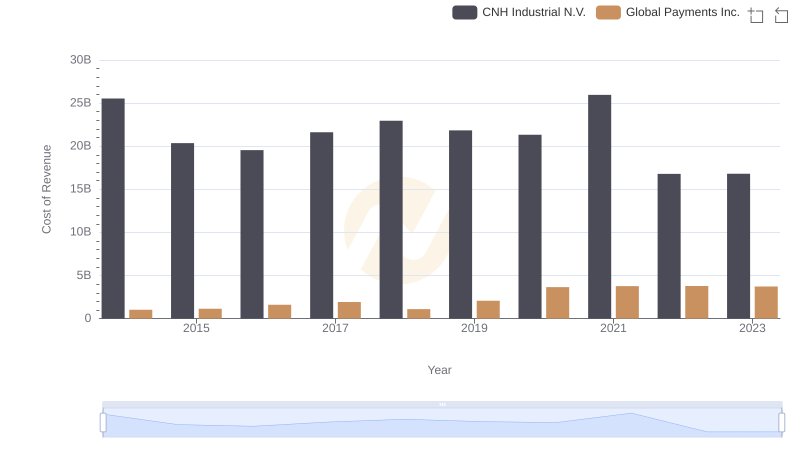
Cost of Revenue Comparison: Global Payments Inc. vs CNH Industrial N.V.
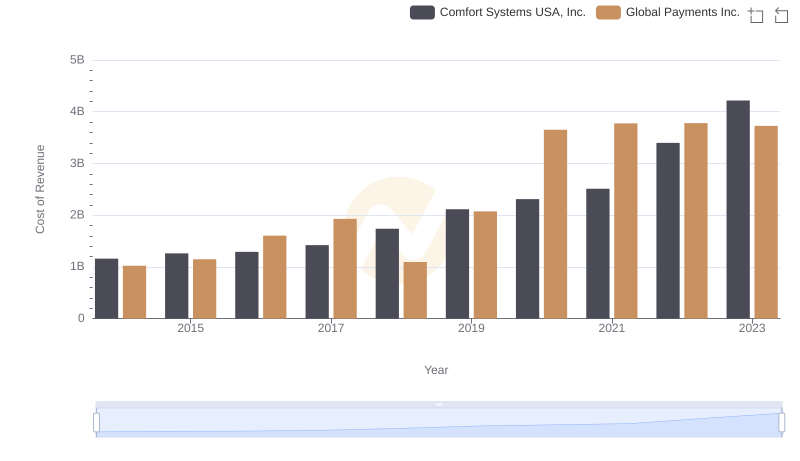
Comparing Cost of Revenue Efficiency: Global Payments Inc. vs Comfort Systems USA, Inc.
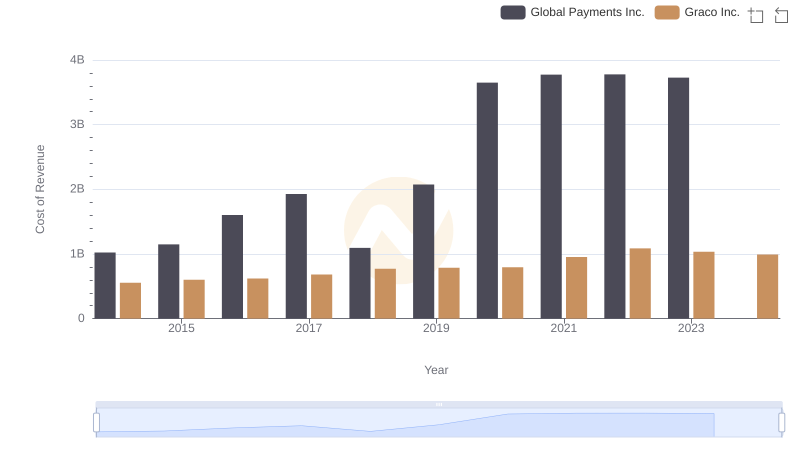
Analyzing Cost of Revenue: Global Payments Inc. and Graco Inc.
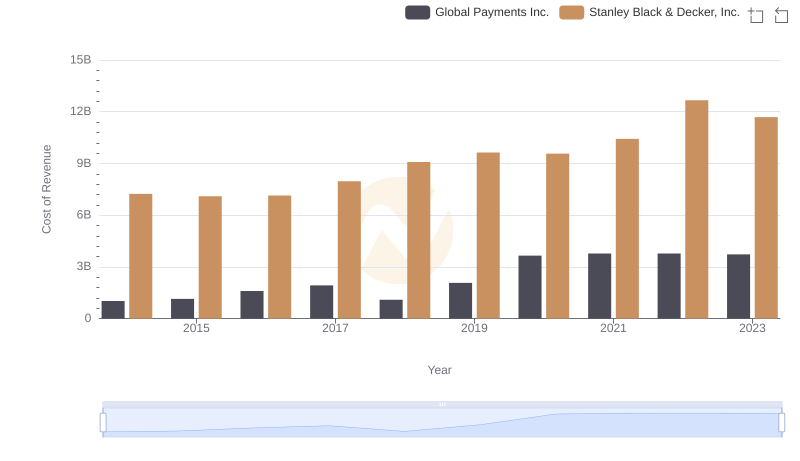
Cost of Revenue Trends: Global Payments Inc. vs Stanley Black & Decker, Inc.
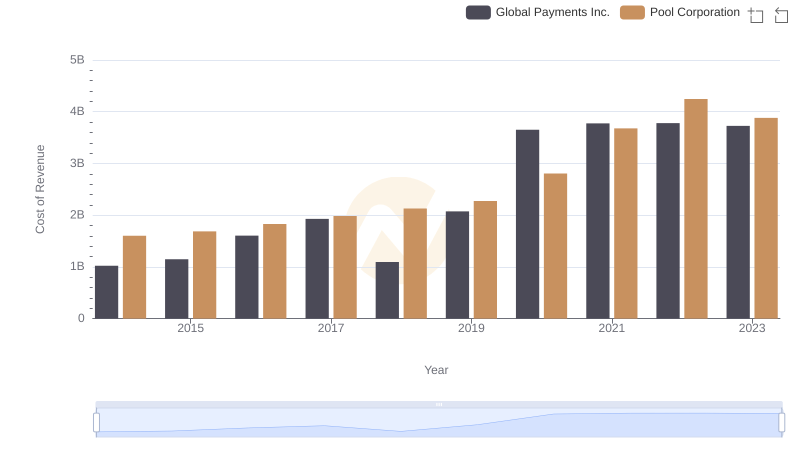
Global Payments Inc. vs Pool Corporation: Efficiency in Cost of Revenue Explored
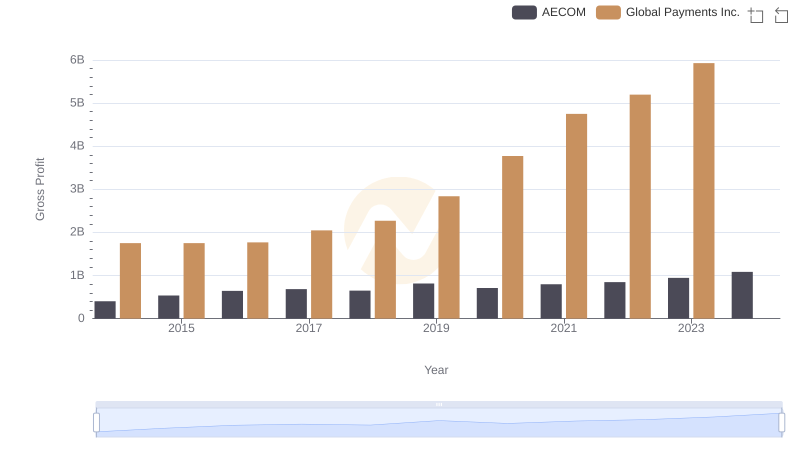
Global Payments Inc. and AECOM: A Detailed Gross Profit Analysis

Analyzing Cost of Revenue: Global Payments Inc. and U-Haul Holding Company
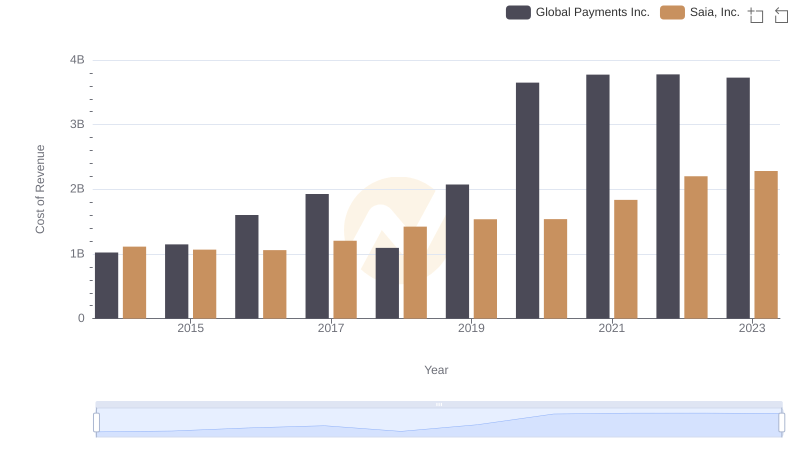
Global Payments Inc. vs Saia, Inc.: Efficiency in Cost of Revenue Explored
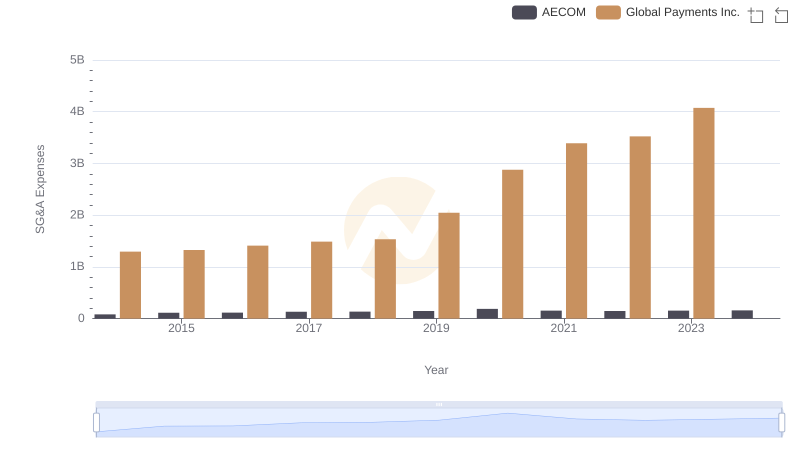
Global Payments Inc. and AECOM: SG&A Spending Patterns Compared
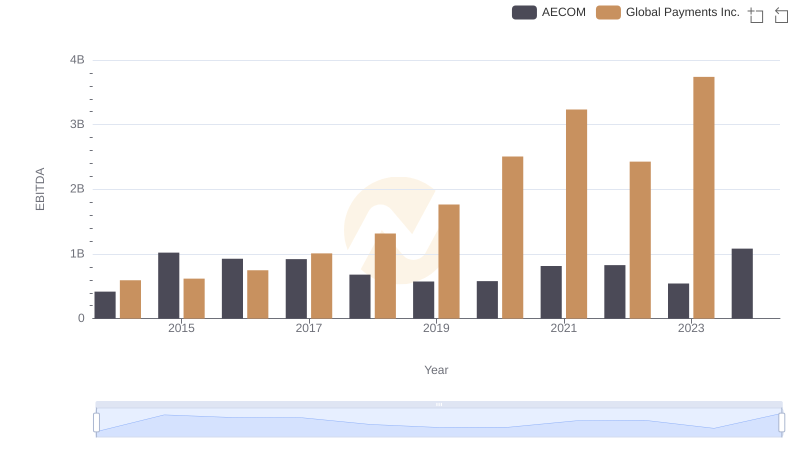
A Professional Review of EBITDA: Global Payments Inc. Compared to AECOM