| __timestamp | CNH Industrial N.V. | Global Payments Inc. |
|---|---|---|
| Wednesday, January 1, 2014 | 32555000000 | 2773718000 |
| Thursday, January 1, 2015 | 25912000000 | 2898150000 |
| Friday, January 1, 2016 | 24872000000 | 3370976000 |
| Sunday, January 1, 2017 | 27361000000 | 3975163000 |
| Monday, January 1, 2018 | 29706000000 | 3366366000 |
| Tuesday, January 1, 2019 | 28079000000 | 4911892000 |
| Wednesday, January 1, 2020 | 26032000000 | 7423558000 |
| Friday, January 1, 2021 | 33428000000 | 8523762000 |
| Saturday, January 1, 2022 | 23551000000 | 8975515000 |
| Sunday, January 1, 2023 | 24694000000 | 9654419000 |
| Monday, January 1, 2024 | 10105894000 |
In pursuit of knowledge
In the ever-evolving landscape of global finance and industrial sectors, understanding revenue trends is crucial. Over the past decade, Global Payments Inc. and CNH Industrial N.V. have showcased contrasting revenue trajectories. From 2014 to 2023, CNH Industrial N.V. experienced a revenue decline of approximately 24%, starting at a peak in 2014 and witnessing fluctuations, with a notable dip in 2022. In contrast, Global Payments Inc. has seen a robust growth of nearly 248% over the same period, reflecting its strategic expansion and adaptation to digital payment trends.
The year 2021 marked a significant revenue peak for CNH Industrial N.V., while Global Payments Inc. continued its upward trajectory, reaching its highest revenue in 2023. These insights highlight the dynamic nature of these industries and underscore the importance of strategic innovation and market adaptation.
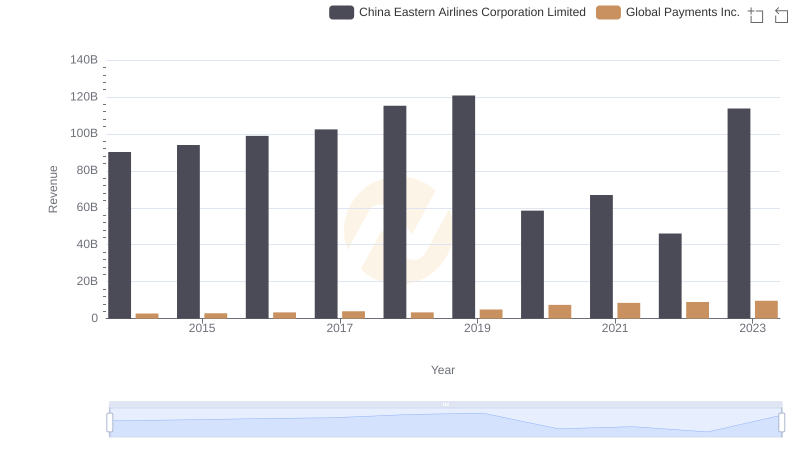
Who Generates More Revenue? Global Payments Inc. or China Eastern Airlines Corporation Limited
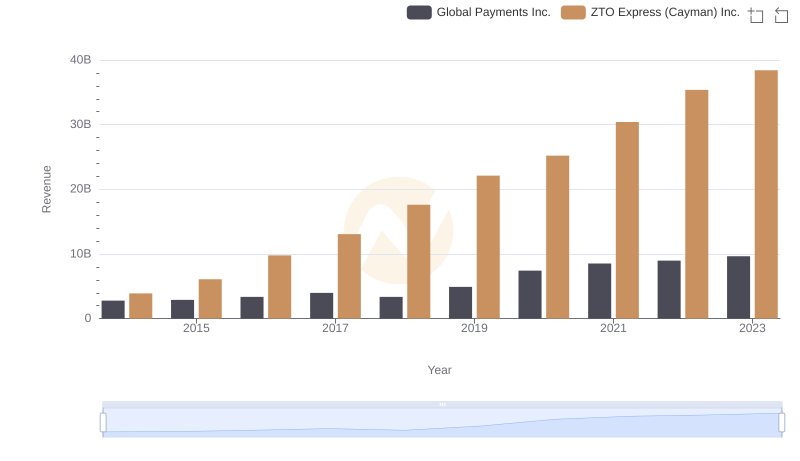
Who Generates More Revenue? Global Payments Inc. or ZTO Express (Cayman) Inc.
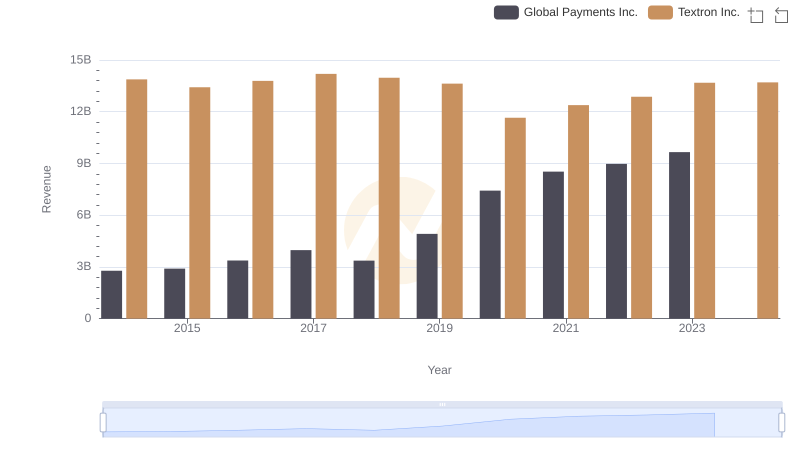
Global Payments Inc. and Textron Inc.: A Comprehensive Revenue Analysis
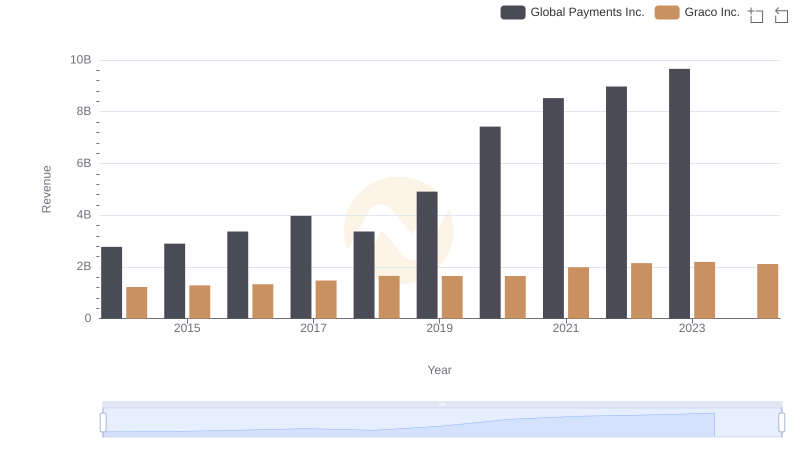
Revenue Showdown: Global Payments Inc. vs Graco Inc.
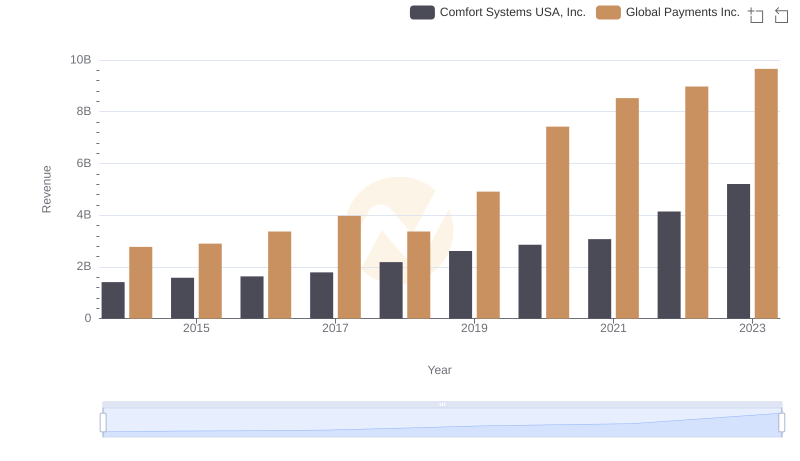
Revenue Insights: Global Payments Inc. and Comfort Systems USA, Inc. Performance Compared
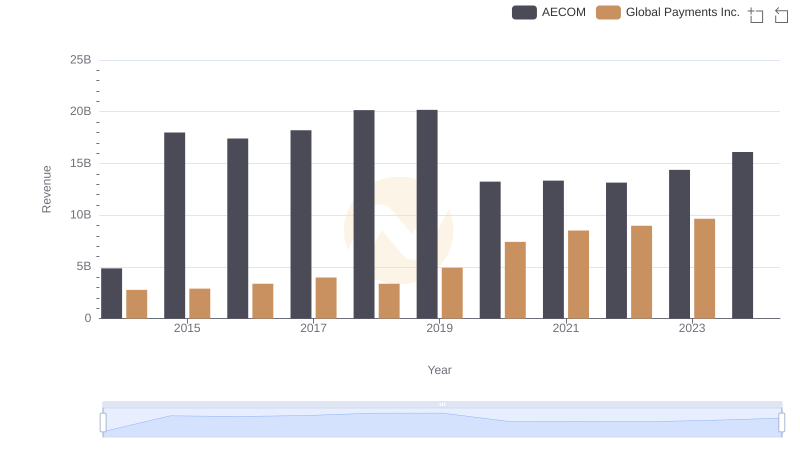
Annual Revenue Comparison: Global Payments Inc. vs AECOM
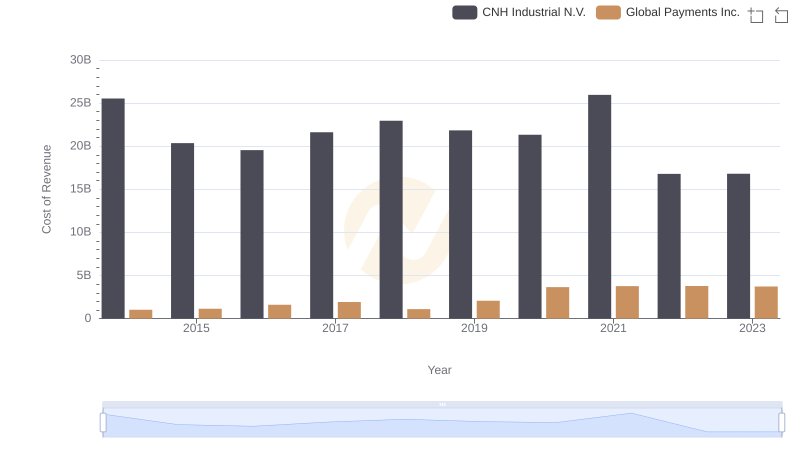
Cost of Revenue Comparison: Global Payments Inc. vs CNH Industrial N.V.
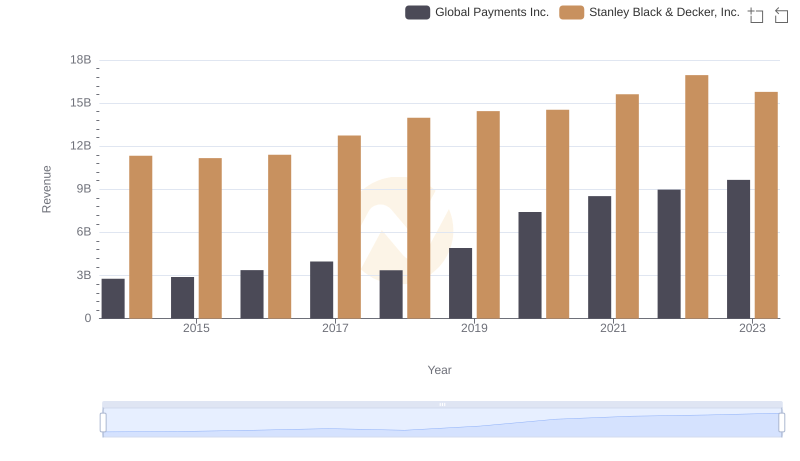
Revenue Insights: Global Payments Inc. and Stanley Black & Decker, Inc. Performance Compared
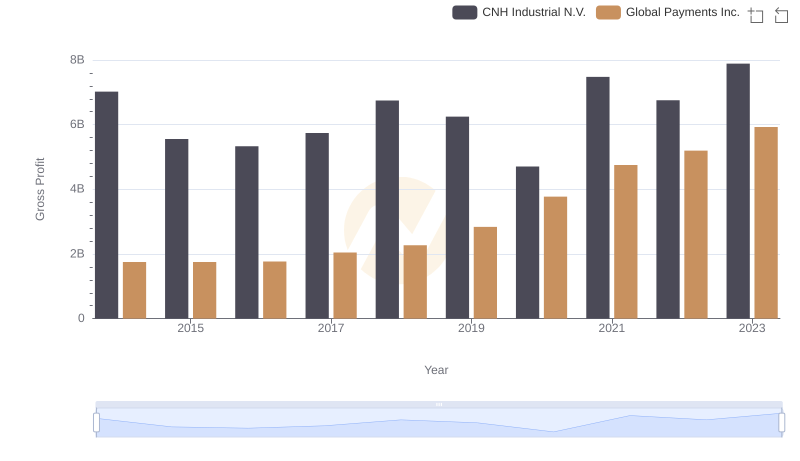
Key Insights on Gross Profit: Global Payments Inc. vs CNH Industrial N.V.
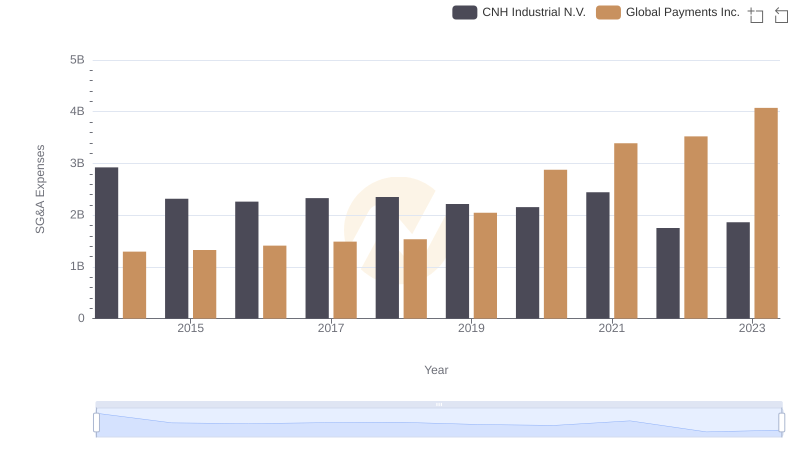
Global Payments Inc. or CNH Industrial N.V.: Who Manages SG&A Costs Better?
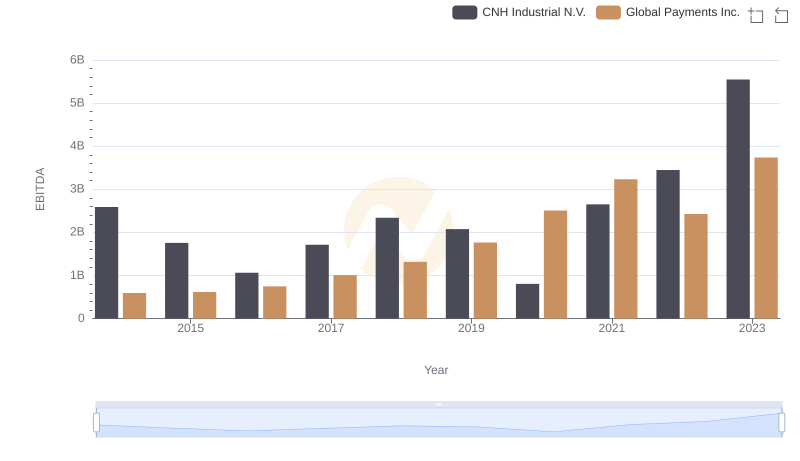
A Side-by-Side Analysis of EBITDA: Global Payments Inc. and CNH Industrial N.V.