| __timestamp | Global Payments Inc. | U-Haul Holding Company |
|---|---|---|
| Wednesday, January 1, 2014 | 2773718000 | 2835252000 |
| Thursday, January 1, 2015 | 2898150000 | 3074531000 |
| Friday, January 1, 2016 | 3370976000 | 3275656000 |
| Sunday, January 1, 2017 | 3975163000 | 3421767000 |
| Monday, January 1, 2018 | 3366366000 | 3601114000 |
| Tuesday, January 1, 2019 | 4911892000 | 3768707000 |
| Wednesday, January 1, 2020 | 7423558000 | 3978868000 |
| Friday, January 1, 2021 | 8523762000 | 4541985000 |
| Saturday, January 1, 2022 | 8975515000 | 5739747000 |
| Sunday, January 1, 2023 | 9654419000 | 5864691000 |
| Monday, January 1, 2024 | 10105894000 | 5625674000 |
Unleashing the power of data
In the ever-evolving landscape of corporate finance, the revenue trajectories of Global Payments Inc. and U-Haul Holding Company offer a fascinating study. Over the past decade, Global Payments Inc. has seen its revenue soar by approximately 248%, starting from 2014 with a modest $2.8 billion and reaching nearly $9.7 billion by 2023. This impressive growth underscores the company's strategic expansions and acquisitions in the payment processing industry.
Conversely, U-Haul Holding Company, a stalwart in the moving and storage sector, has experienced a steady revenue increase of about 107% over the same period. From $2.8 billion in 2014, U-Haul's revenue climbed to $5.9 billion in 2023, reflecting its resilience and adaptability in a competitive market.
While Global Payments Inc. leads in absolute growth, U-Haul's consistent performance highlights its enduring market presence. Missing data for 2024 suggests potential future developments worth watching.
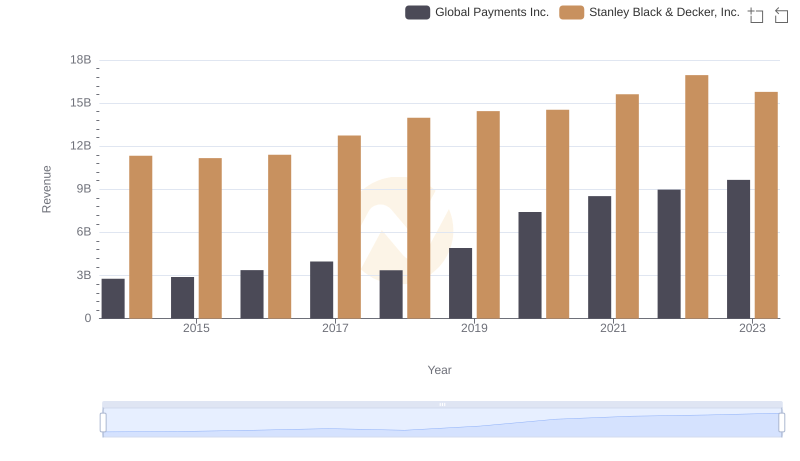
Revenue Insights: Global Payments Inc. and Stanley Black & Decker, Inc. Performance Compared
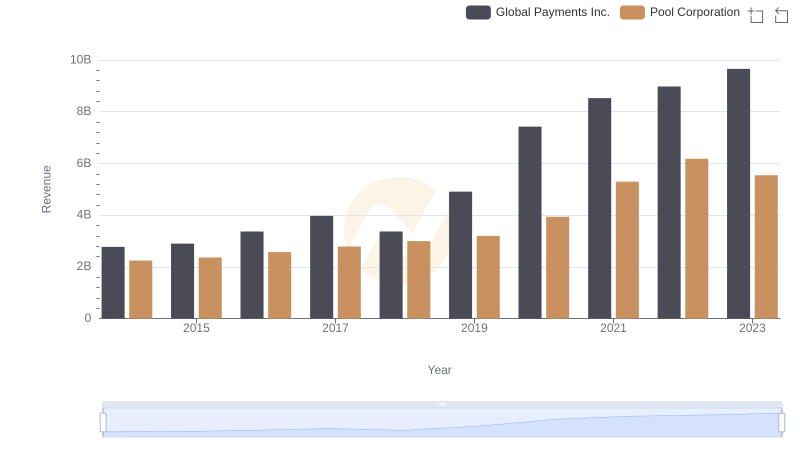
Revenue Showdown: Global Payments Inc. vs Pool Corporation
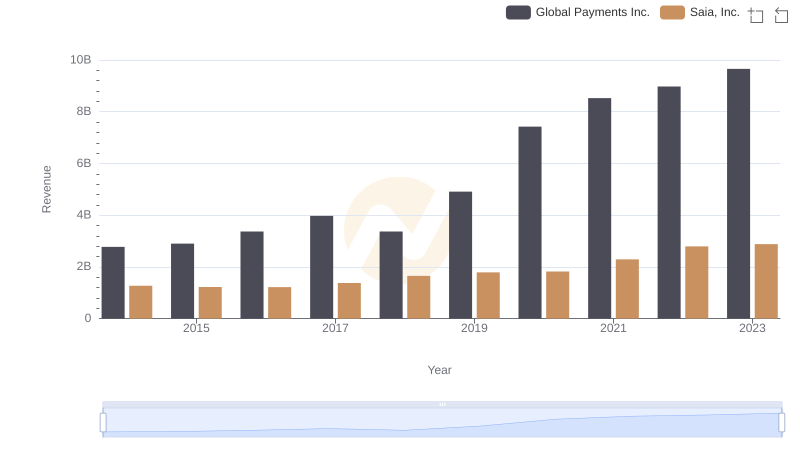
Global Payments Inc. and Saia, Inc.: A Comprehensive Revenue Analysis
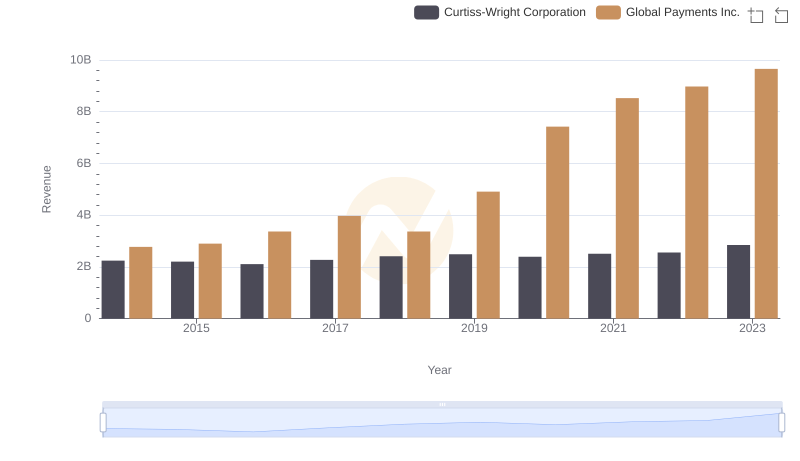
Annual Revenue Comparison: Global Payments Inc. vs Curtiss-Wright Corporation
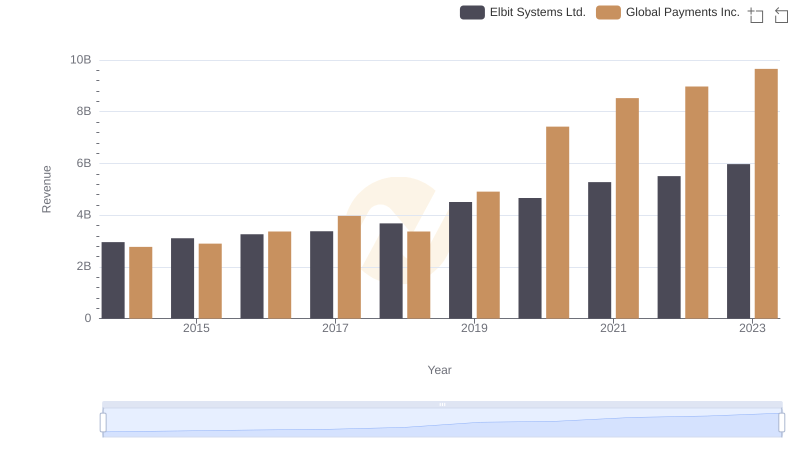
Global Payments Inc. vs Elbit Systems Ltd.: Annual Revenue Growth Compared

Breaking Down Revenue Trends: Global Payments Inc. vs C.H. Robinson Worldwide, Inc.

Analyzing Cost of Revenue: Global Payments Inc. and U-Haul Holding Company
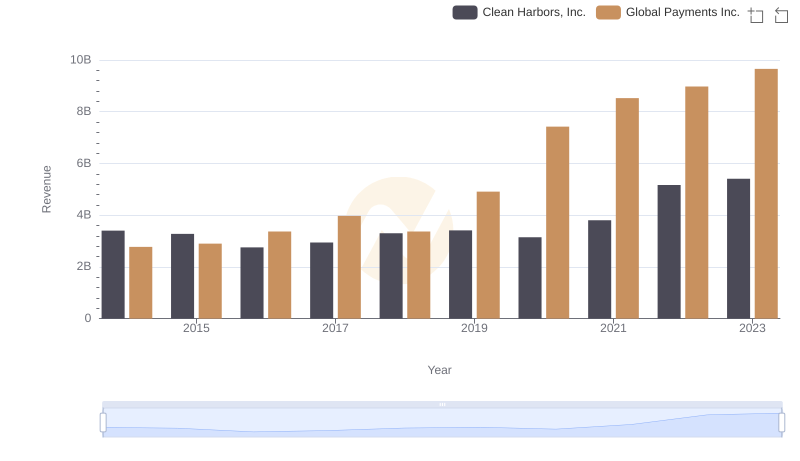
Global Payments Inc. or Clean Harbors, Inc.: Who Leads in Yearly Revenue?
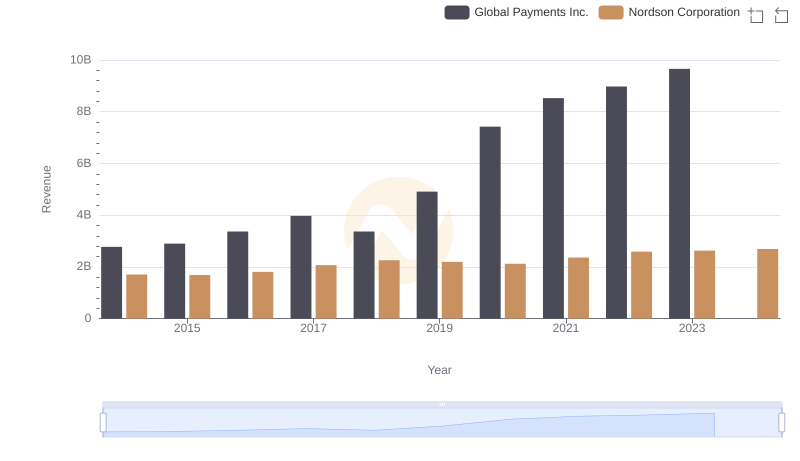
Global Payments Inc. vs Nordson Corporation: Examining Key Revenue Metrics
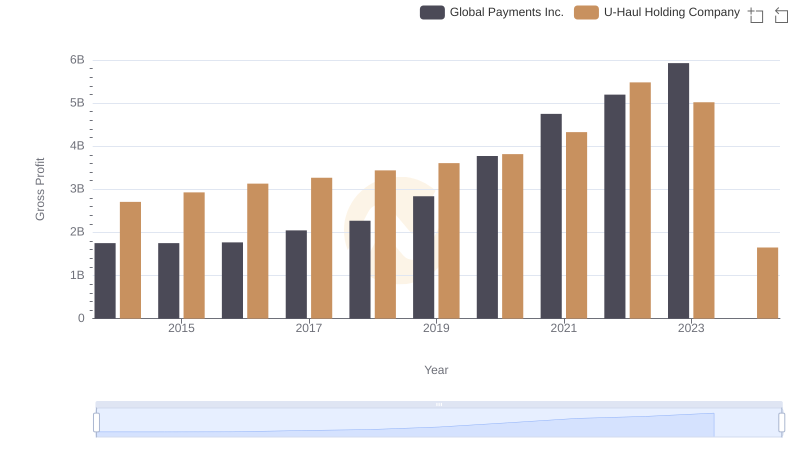
Gross Profit Comparison: Global Payments Inc. and U-Haul Holding Company Trends
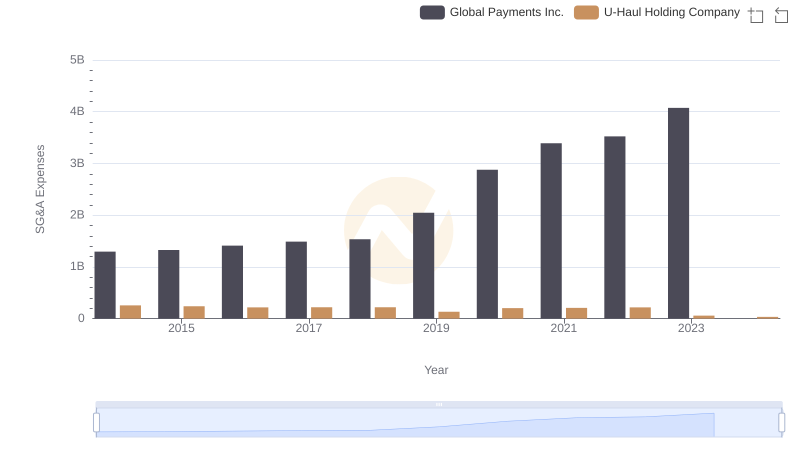
Cost Management Insights: SG&A Expenses for Global Payments Inc. and U-Haul Holding Company