| __timestamp | AECOM | Global Payments Inc. |
|---|---|---|
| Wednesday, January 1, 2014 | 403176000 | 1751611000 |
| Thursday, January 1, 2015 | 535188000 | 1750511000 |
| Friday, January 1, 2016 | 642824000 | 1767444000 |
| Sunday, January 1, 2017 | 683720000 | 2047126000 |
| Monday, January 1, 2018 | 650649000 | 2271352000 |
| Tuesday, January 1, 2019 | 813445000 | 2838089000 |
| Wednesday, January 1, 2020 | 709560000 | 3772831000 |
| Friday, January 1, 2021 | 798421000 | 4750037000 |
| Saturday, January 1, 2022 | 847974000 | 5196898000 |
| Sunday, January 1, 2023 | 945465000 | 5926898000 |
| Monday, January 1, 2024 | 1084341000 | 6345778000 |
Infusing magic into the data realm
In the ever-evolving landscape of global finance and infrastructure, AECOM and Global Payments Inc. stand as titans in their respective fields. Over the past decade, these companies have showcased remarkable growth in gross profit, reflecting their strategic prowess and market adaptability. From 2014 to 2023, AECOM's gross profit surged by approximately 170%, highlighting its robust expansion in infrastructure services. Meanwhile, Global Payments Inc. experienced an impressive 240% increase, underscoring its dominance in the payment processing industry.
This analysis not only underscores the resilience of these industry leaders but also offers a glimpse into the future of global commerce and infrastructure development.
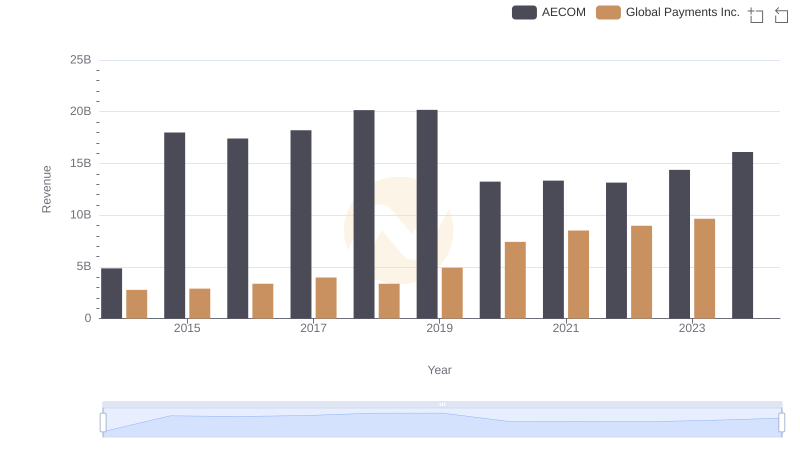
Annual Revenue Comparison: Global Payments Inc. vs AECOM
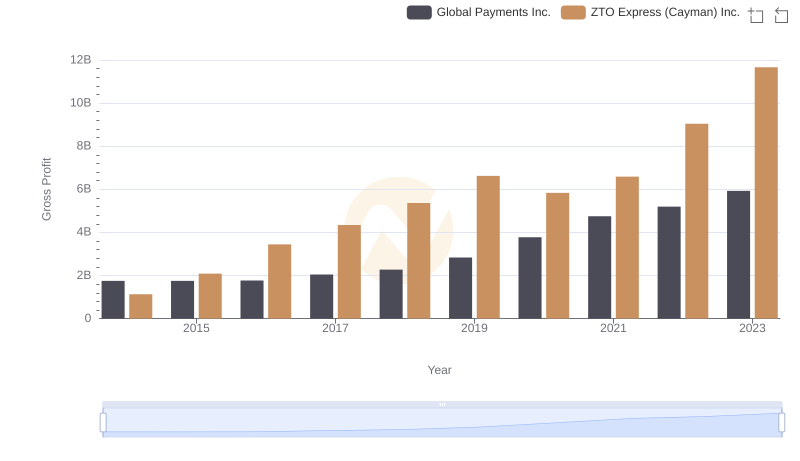
Global Payments Inc. vs ZTO Express (Cayman) Inc.: A Gross Profit Performance Breakdown

Comparing Cost of Revenue Efficiency: Global Payments Inc. vs AECOM
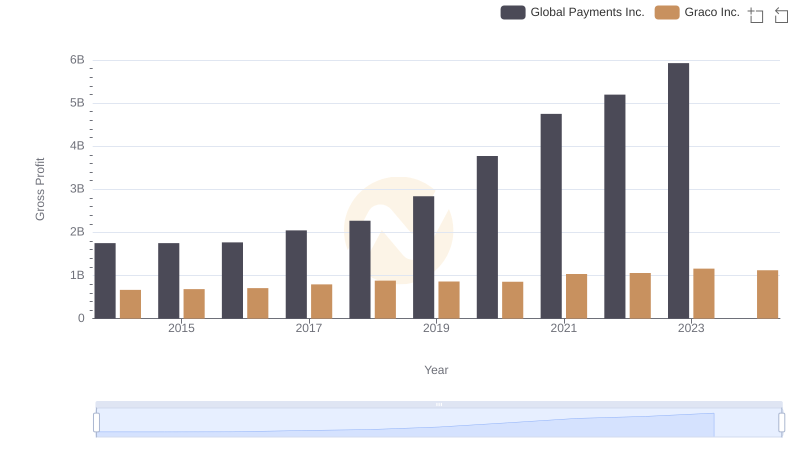
Gross Profit Comparison: Global Payments Inc. and Graco Inc. Trends
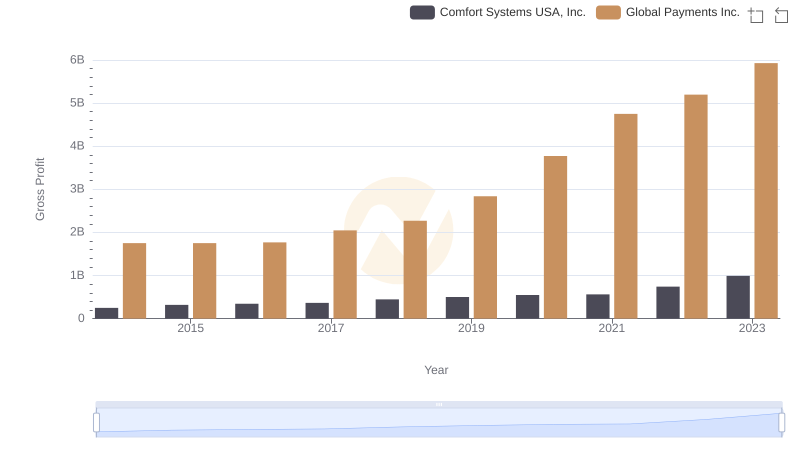
Who Generates Higher Gross Profit? Global Payments Inc. or Comfort Systems USA, Inc.
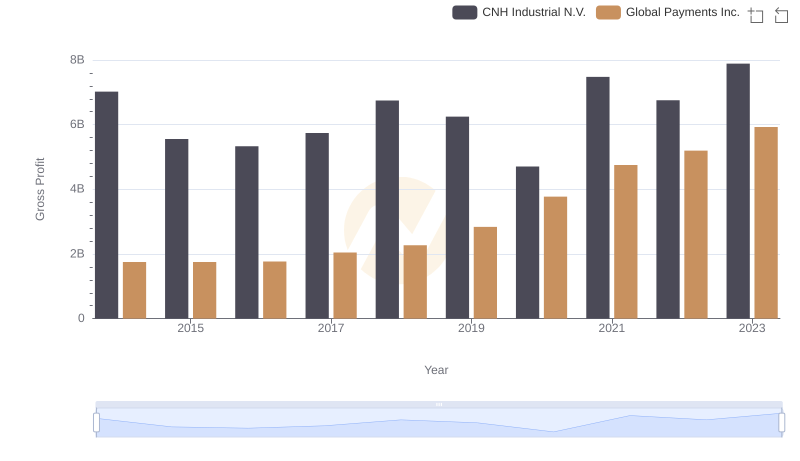
Key Insights on Gross Profit: Global Payments Inc. vs CNH Industrial N.V.
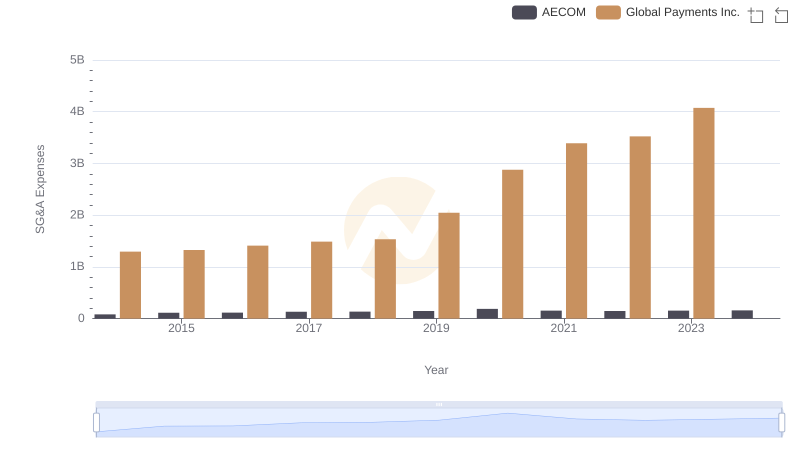
Global Payments Inc. and AECOM: SG&A Spending Patterns Compared

Key Insights on Gross Profit: Global Payments Inc. vs Pool Corporation
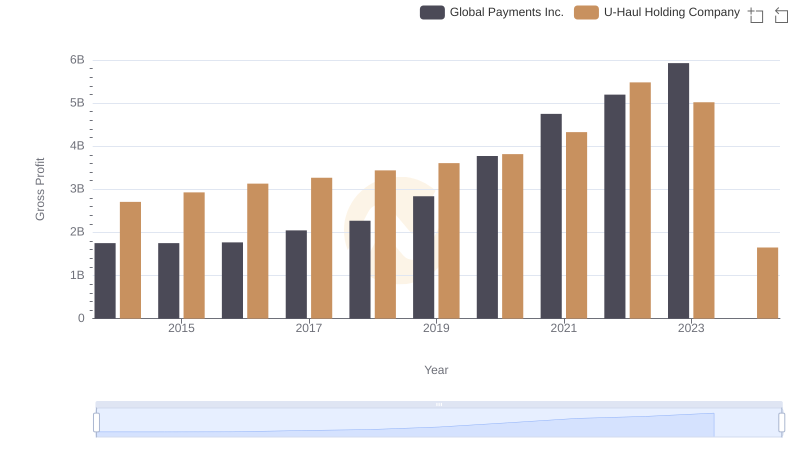
Gross Profit Comparison: Global Payments Inc. and U-Haul Holding Company Trends
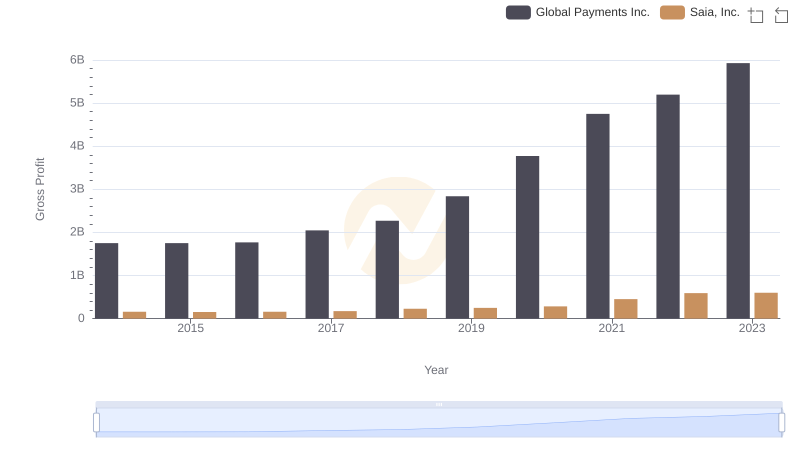
Who Generates Higher Gross Profit? Global Payments Inc. or Saia, Inc.
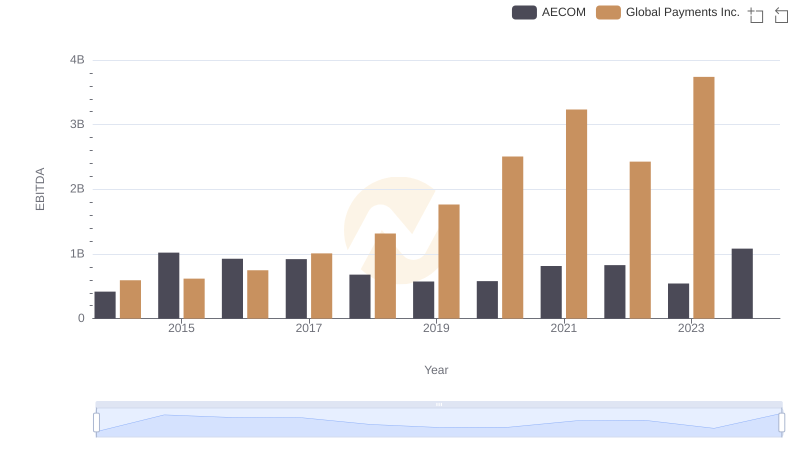
A Professional Review of EBITDA: Global Payments Inc. Compared to AECOM