| __timestamp | Owens Corning | United Rentals, Inc. |
|---|---|---|
| Wednesday, January 1, 2014 | 5276000000 | 5685000000 |
| Thursday, January 1, 2015 | 5350000000 | 5817000000 |
| Friday, January 1, 2016 | 5677000000 | 5762000000 |
| Sunday, January 1, 2017 | 6384000000 | 6641000000 |
| Monday, January 1, 2018 | 7057000000 | 8047000000 |
| Tuesday, January 1, 2019 | 7160000000 | 9351000000 |
| Wednesday, January 1, 2020 | 7055000000 | 8530000000 |
| Friday, January 1, 2021 | 8498000000 | 9716000000 |
| Saturday, January 1, 2022 | 9761000000 | 11642000000 |
| Sunday, January 1, 2023 | 9677000000 | 14332000000 |
| Monday, January 1, 2024 | 15345000000 |
Data in motion
In the ever-evolving landscape of industrial growth, United Rentals, Inc. and Owens Corning stand as titans of their respective domains. Over the past decade, these companies have showcased remarkable revenue trajectories, reflecting broader economic trends and strategic business maneuvers.
From 2014 to 2023, United Rentals, Inc. has seen its revenue soar by approximately 152%, a testament to its robust expansion strategies and market adaptability. In contrast, Owens Corning, a leader in building materials, experienced a steady growth of around 83% during the same period. This divergence highlights the dynamic nature of industrial sectors, where strategic investments and market demands shape financial outcomes.
Interestingly, while United Rentals, Inc. continued its upward trajectory into 2024, Owens Corning's data for the same year remains elusive, leaving room for speculation and anticipation among industry watchers.
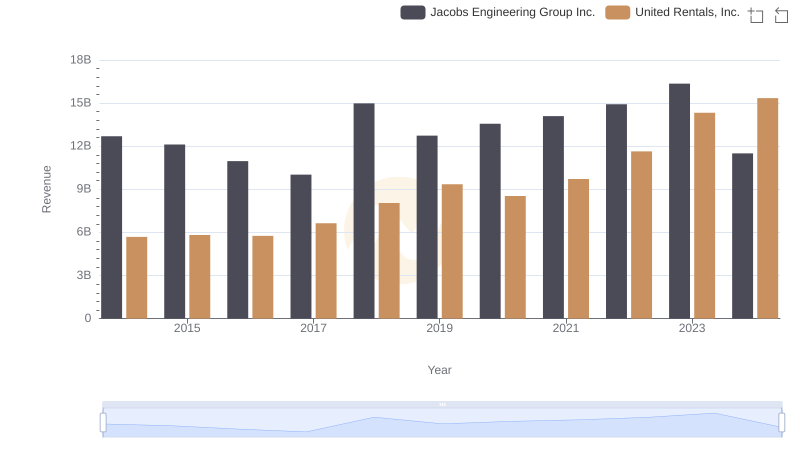
United Rentals, Inc. vs Jacobs Engineering Group Inc.: Annual Revenue Growth Compared
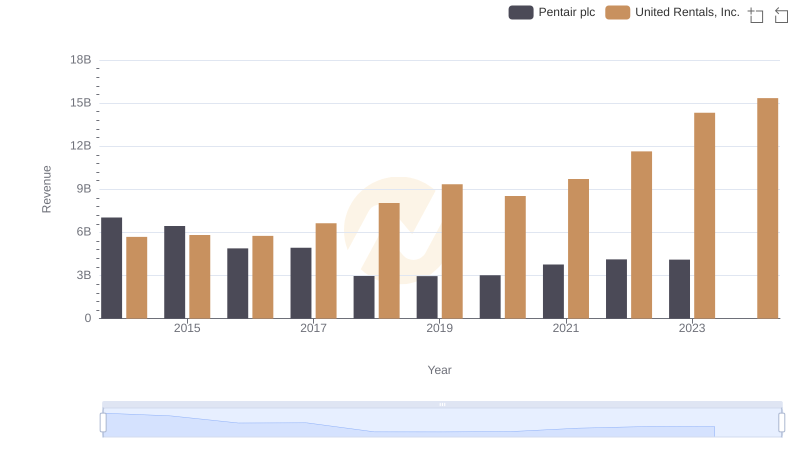
Revenue Showdown: United Rentals, Inc. vs Pentair plc
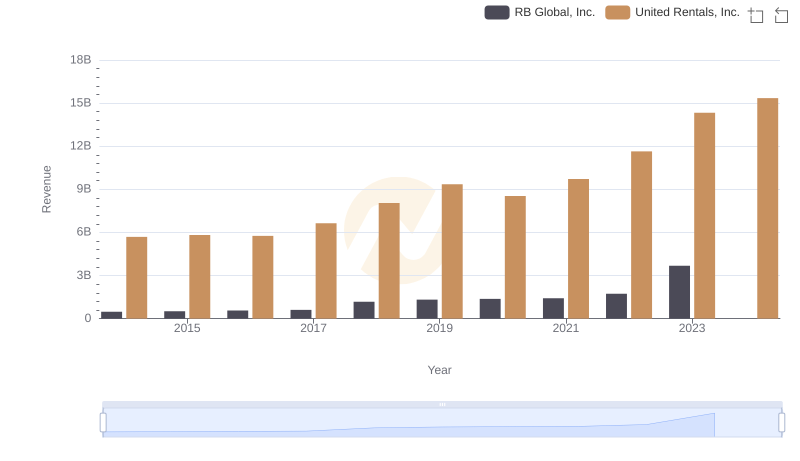
Revenue Insights: United Rentals, Inc. and RB Global, Inc. Performance Compared
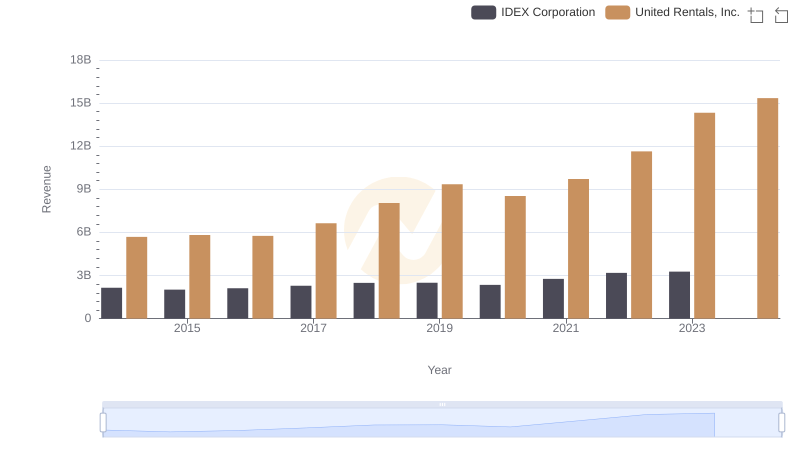
United Rentals, Inc. and IDEX Corporation: A Comprehensive Revenue Analysis
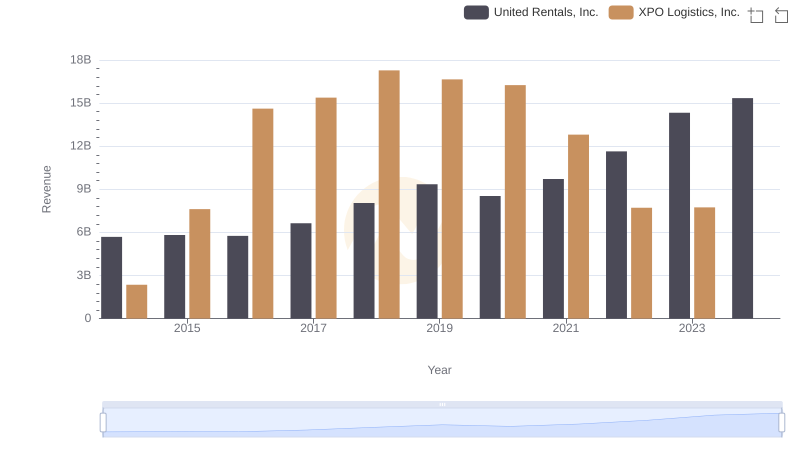
United Rentals, Inc. and XPO Logistics, Inc.: A Comprehensive Revenue Analysis
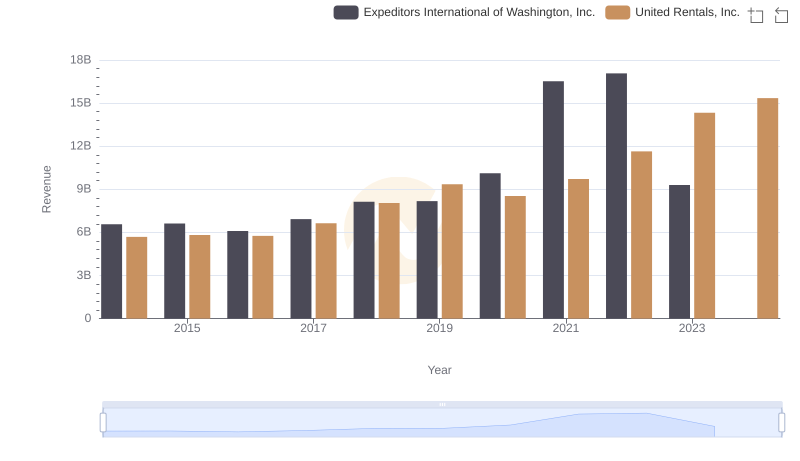
Comparing Revenue Performance: United Rentals, Inc. or Expeditors International of Washington, Inc.?
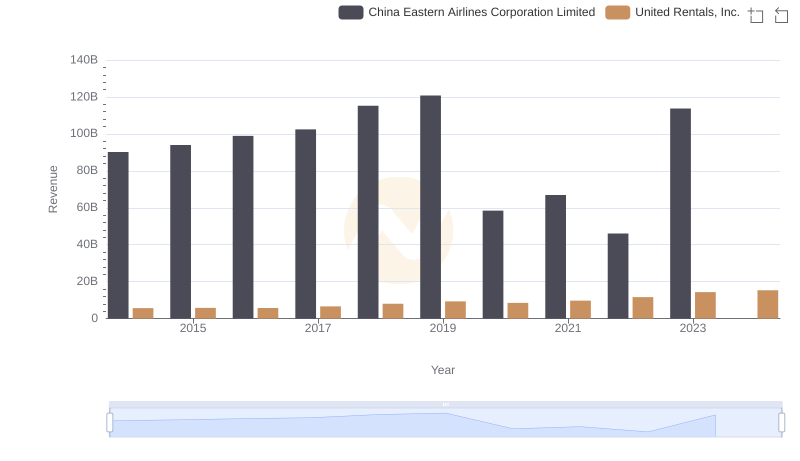
Revenue Insights: United Rentals, Inc. and China Eastern Airlines Corporation Limited Performance Compared
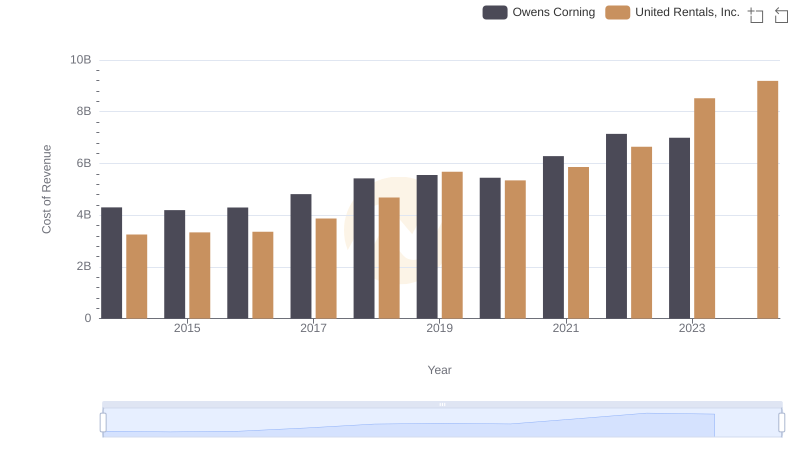
Analyzing Cost of Revenue: United Rentals, Inc. and Owens Corning
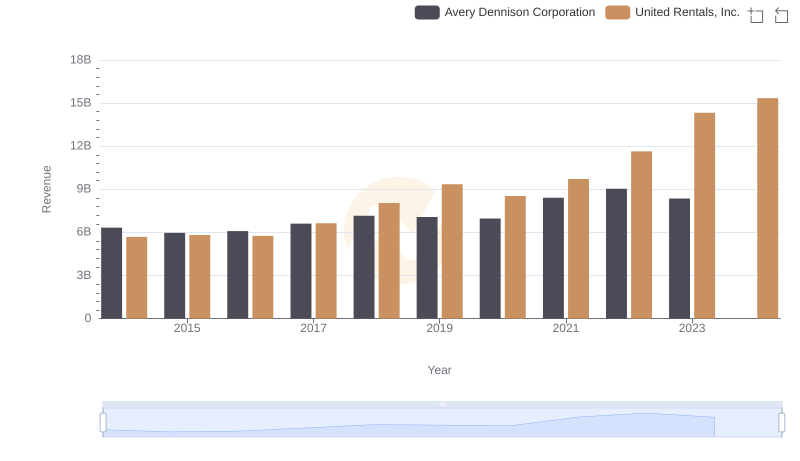
United Rentals, Inc. vs Avery Dennison Corporation: Examining Key Revenue Metrics
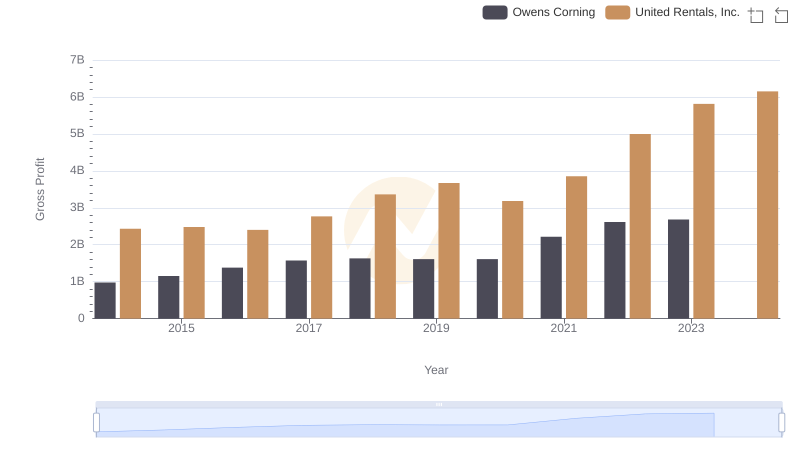
United Rentals, Inc. and Owens Corning: A Detailed Gross Profit Analysis
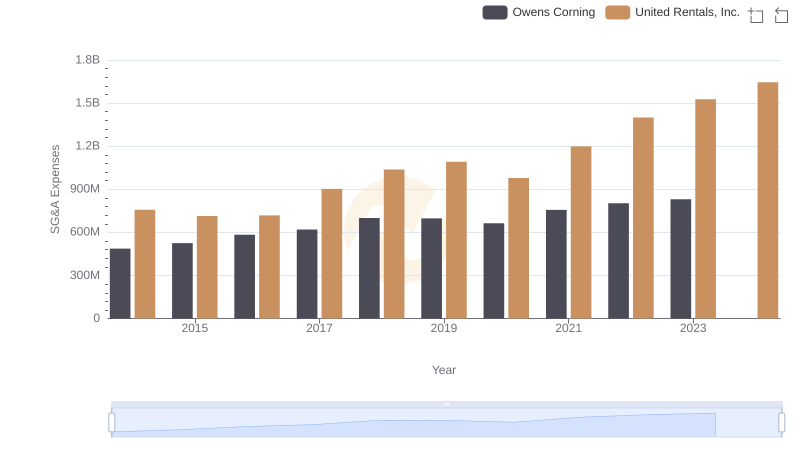
Breaking Down SG&A Expenses: United Rentals, Inc. vs Owens Corning

United Rentals, Inc. vs Owens Corning: In-Depth EBITDA Performance Comparison