| __timestamp | Ferrovial SE | United Rentals, Inc. |
|---|---|---|
| Wednesday, January 1, 2014 | 7671000000 | 2432000000 |
| Thursday, January 1, 2015 | 8556000000 | 2480000000 |
| Friday, January 1, 2016 | 9491000000 | 2403000000 |
| Sunday, January 1, 2017 | 10864000000 | 2769000000 |
| Monday, January 1, 2018 | 4752000000 | 3364000000 |
| Tuesday, January 1, 2019 | 5105000000 | 3670000000 |
| Wednesday, January 1, 2020 | 5336000000 | 3183000000 |
| Friday, January 1, 2021 | 5701000000 | 3853000000 |
| Saturday, January 1, 2022 | 6354000000 | 4996000000 |
| Sunday, January 1, 2023 | 7385000000 | 5813000000 |
| Monday, January 1, 2024 | 6150000000 |
Infusing magic into the data realm
In the competitive world of construction and infrastructure, two titans stand out: United Rentals, Inc. and Ferrovial SE. Over the past decade, these companies have showcased their prowess in generating gross profit, a key indicator of financial health. From 2014 to 2023, Ferrovial SE consistently outperformed United Rentals, Inc., boasting a gross profit that was, on average, nearly double. However, the gap has been narrowing. By 2023, United Rentals, Inc. achieved a remarkable 58% increase in gross profit compared to 2014, reaching approximately $5.8 billion. Meanwhile, Ferrovial SE experienced fluctuations, with a notable dip in 2018. Despite this, they rebounded to a gross profit of around $7.4 billion in 2023. As we look to the future, the missing data for 2024 leaves us in suspense, eager to see if United Rentals, Inc. will continue its upward trajectory.
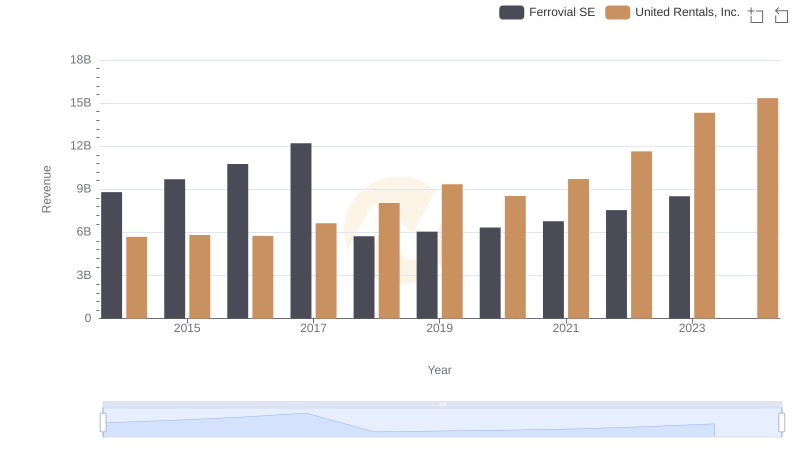
United Rentals, Inc. or Ferrovial SE: Who Leads in Yearly Revenue?
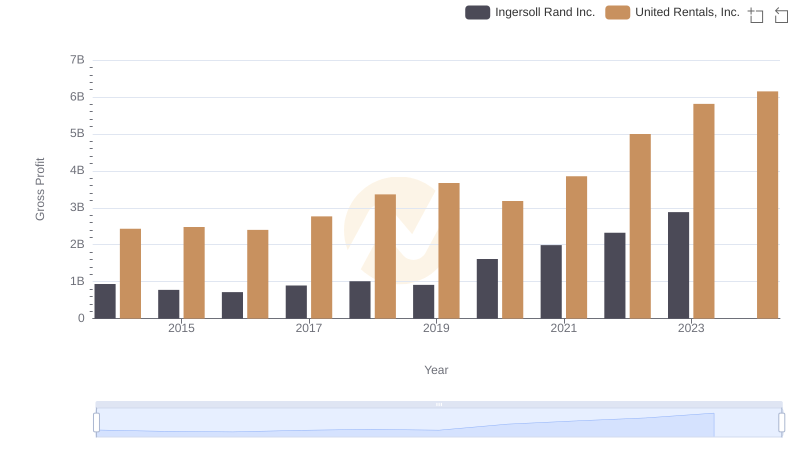
United Rentals, Inc. and Ingersoll Rand Inc.: A Detailed Gross Profit Analysis
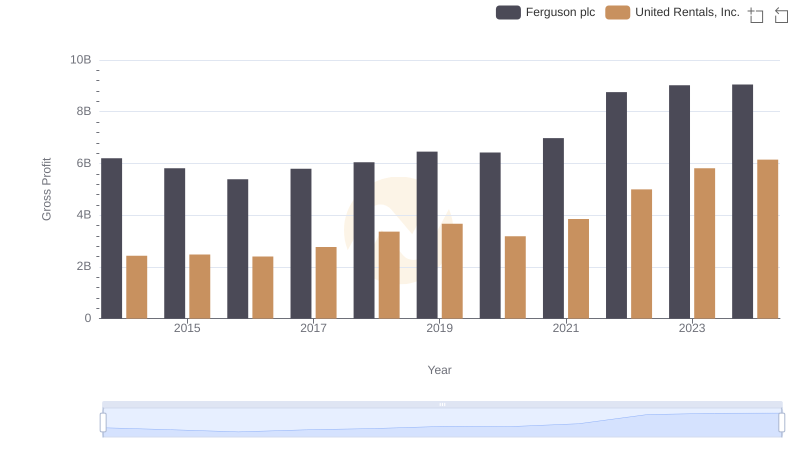
Key Insights on Gross Profit: United Rentals, Inc. vs Ferguson plc
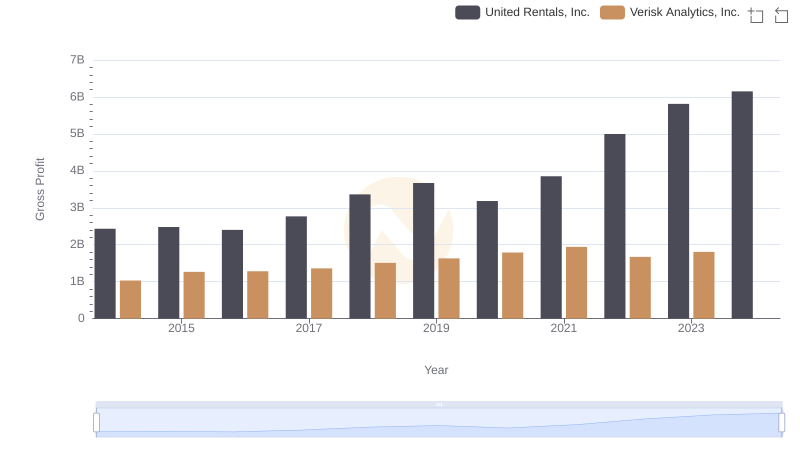
Gross Profit Trends Compared: United Rentals, Inc. vs Verisk Analytics, Inc.
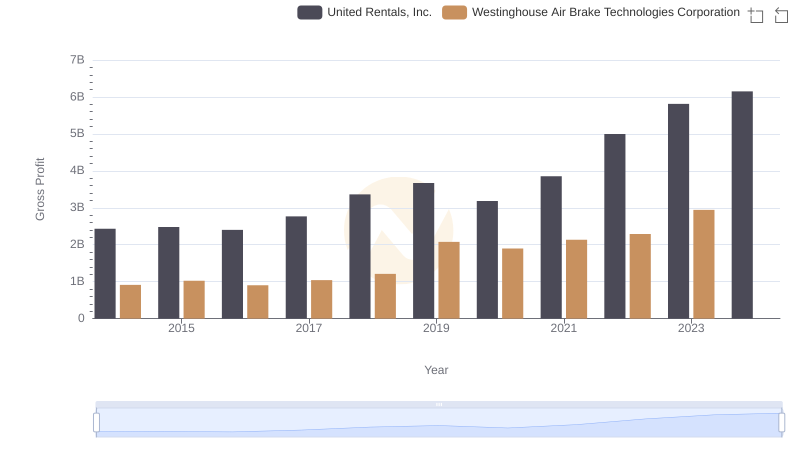
United Rentals, Inc. and Westinghouse Air Brake Technologies Corporation: A Detailed Gross Profit Analysis
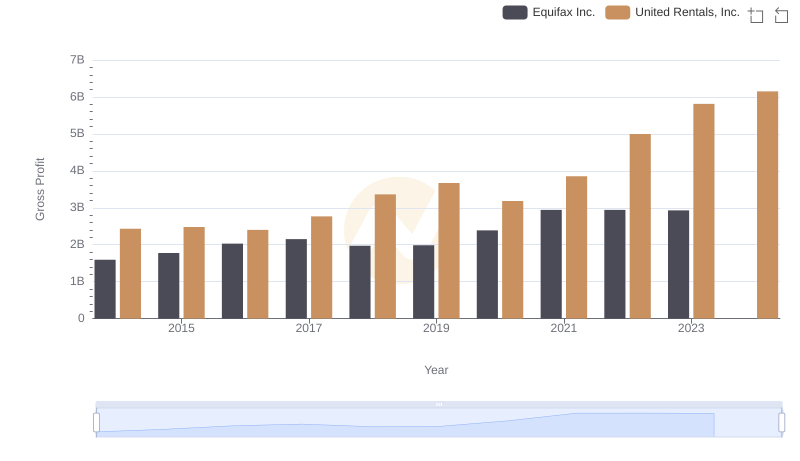
Gross Profit Comparison: United Rentals, Inc. and Equifax Inc. Trends
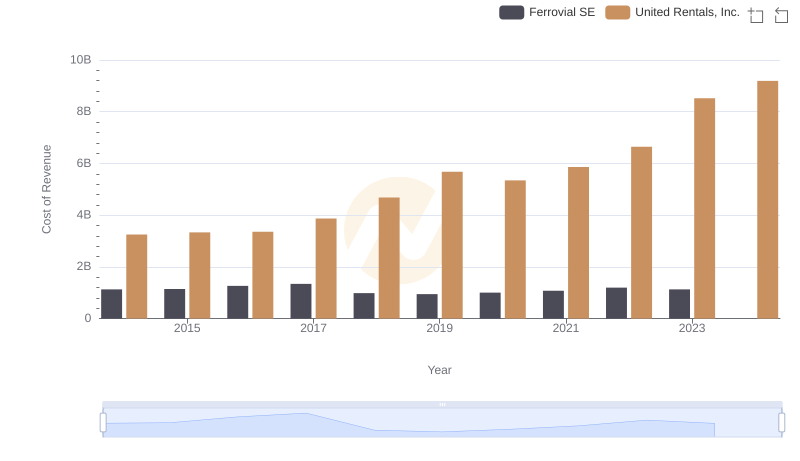
Analyzing Cost of Revenue: United Rentals, Inc. and Ferrovial SE
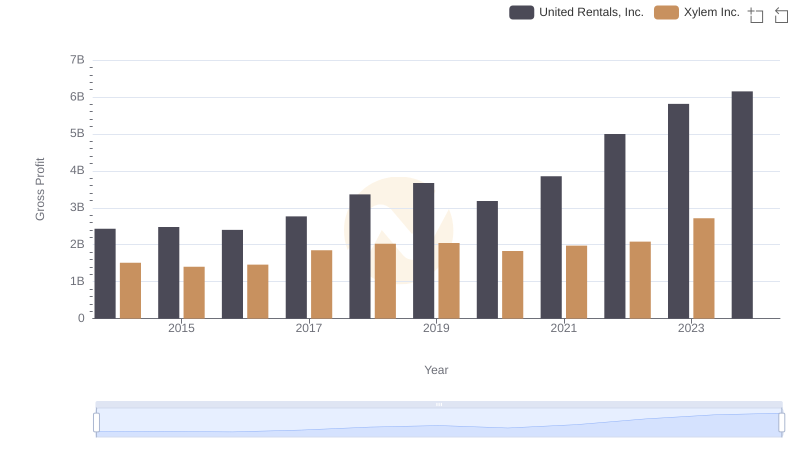
Gross Profit Comparison: United Rentals, Inc. and Xylem Inc. Trends
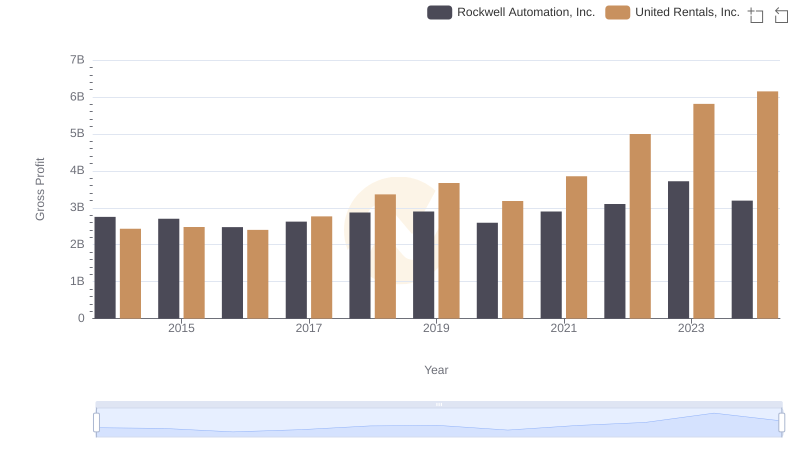
Who Generates Higher Gross Profit? United Rentals, Inc. or Rockwell Automation, Inc.
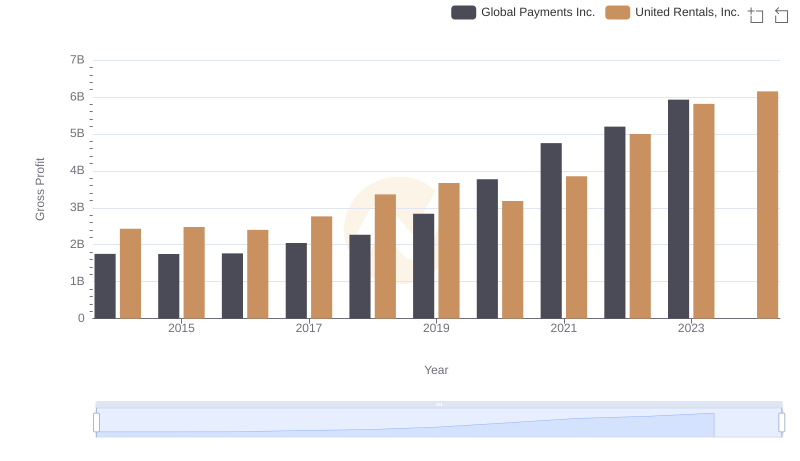
United Rentals, Inc. vs Global Payments Inc.: A Gross Profit Performance Breakdown
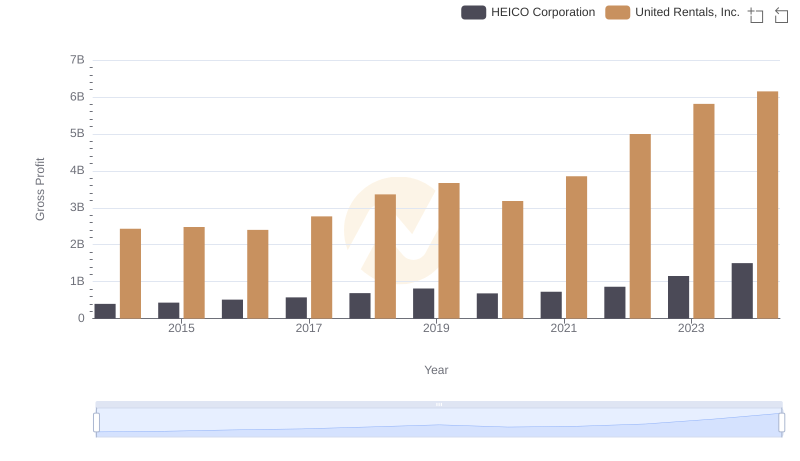
Who Generates Higher Gross Profit? United Rentals, Inc. or HEICO Corporation
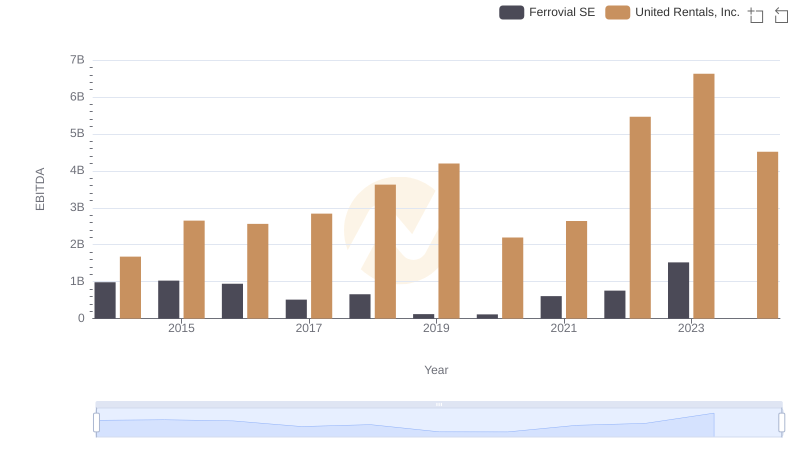
United Rentals, Inc. vs Ferrovial SE: In-Depth EBITDA Performance Comparison